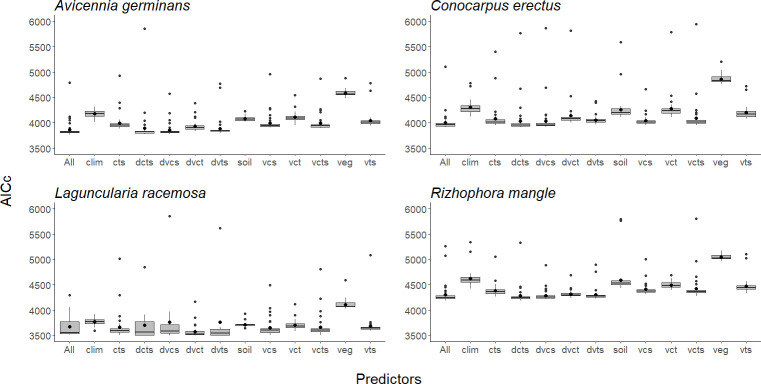
Fig 5. Comparison of Akaike information criterion values (AICc) between different sets of environmental layers for each of the four mangrove species: Avicennia germinans, Conocarpus erectus, Laguncularia racemosa, and Rhizophora mangle.
The black bar inside the box represents the median, the black dot inside the box is the mean, edges of the box are the upper and lower quartile boundaries, and whiskers denote points within the 1.5 times the interquartile range of the upper limit. Atypical values of the distribution are indicated with black dots. Each letter is a class of predictors: d = distance to coast, c = climate variables, s = soil variables, t = topography (digital terrain model), v = vegetation variables.

