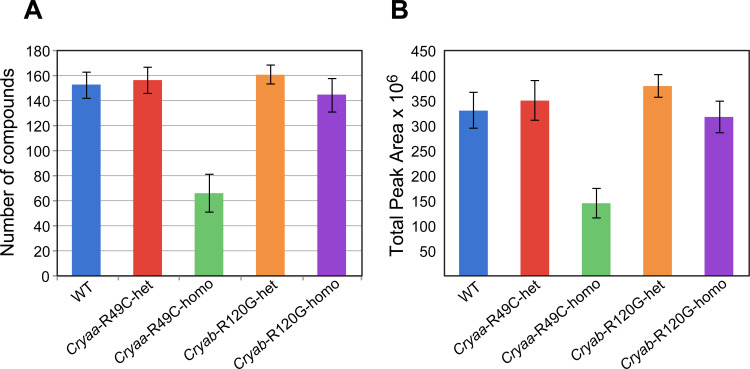
Fig 2. Total number of compounds and average total peak areas in mouse lenses.
Data were analyzed using the MPP software. (A) The total number of compounds and (B) average total peak areas in lenses from WT, Cryaa-R49C-het, Cryaa-R49C-homo, Cryab-R120G-het, and Cryab-R120G-homo mice are shown. The mice were 222 ± 73 days old, and the total number of lenses was 34.

