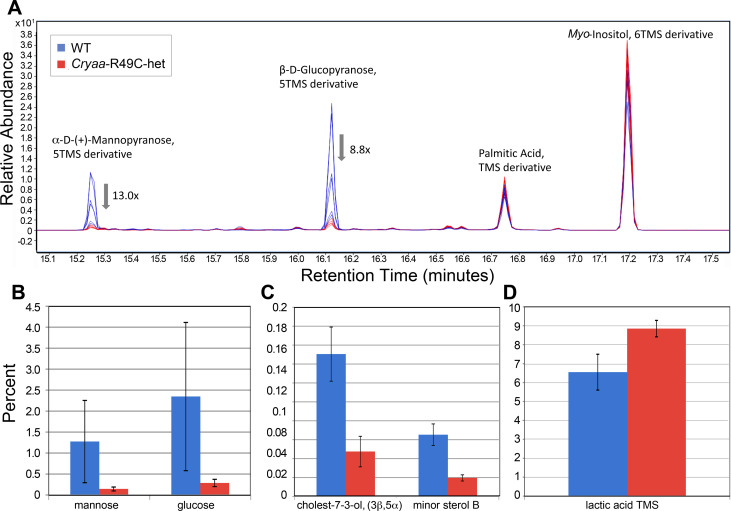
Fig 3.
(A) Representative chromatograms displaying changes in sugars and sterols in mouse lenses. Sugars (B) and sterols (C) in lenses from WT and Cryaa-R49C-het mice are shown. The sugar and sterol content in the mutant lenses were compared to lenses from WT mice. The match factors were 927 and 946 for α-D-mannopyranose and β-D-glucopyranose, respectively. (D) Lactic acid content in cryaa-R49C-het mouse lenses were compared to levels in WT mouse lenses. Data are presented as the means ± S.D. (P < 0.05).

