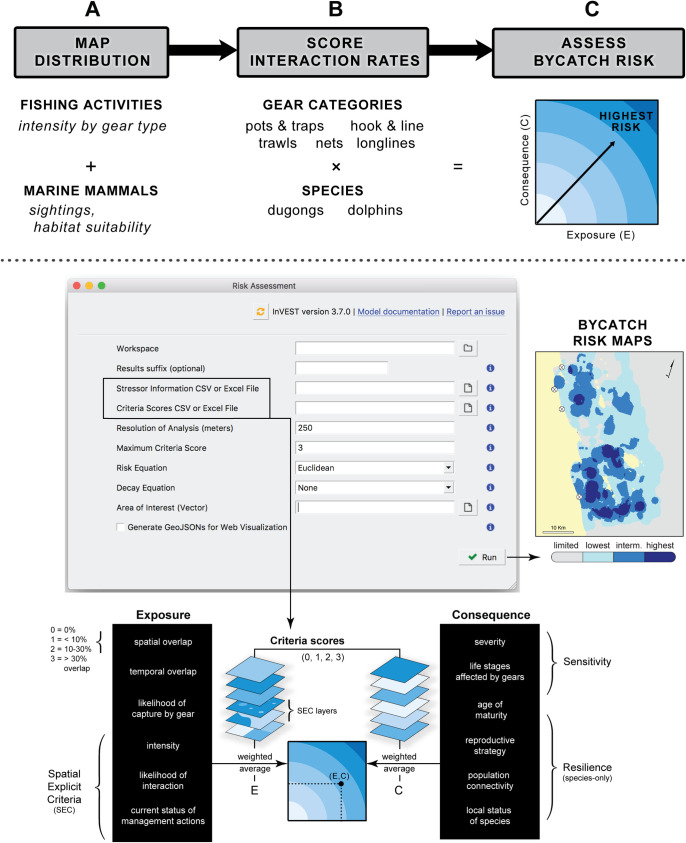
Fig 4. Bycatch risk assessment conceptual model and tool process diagram.
Top panel depicts how layers and rating scores are assembled and combined. Bottom panel shows tool interface and steps to estimate risk for each grid cell within an area of interest. Colored bands in the risk plot are numerically determined and based on the range of exposure and consequence scores (0, 1, 2 and 3 in this assessment).

