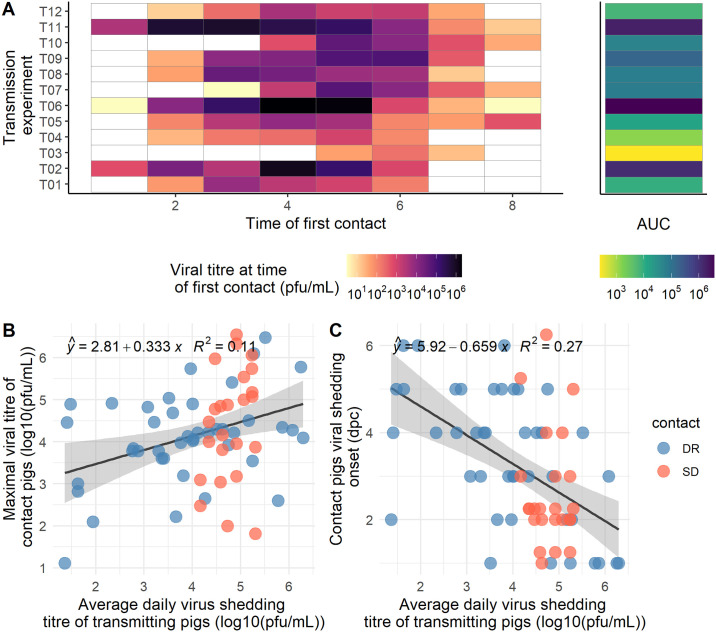
Fig 4. Transmission events and contact shedding.
A. Each row represents a transmission experiment. The color of the tiles from the main panel represent the viral titre of the contact donor pig at the start of the in contact period. The side panel represent the corresponding area under the curve (AUC) in log scale. Transmission experiment T03 was excluded due to the presence of antibody in the contact donor pigs at the start of the experiment. B. Contact pig maximal viral titre vs. average daily virus shedding of parent pigs. C. Contact pig viral shedding onset vs. average daily virus shedding of parent pigs. SD and DR stand for Seeder-Donor and Donor-Recipient contact, respectively.

