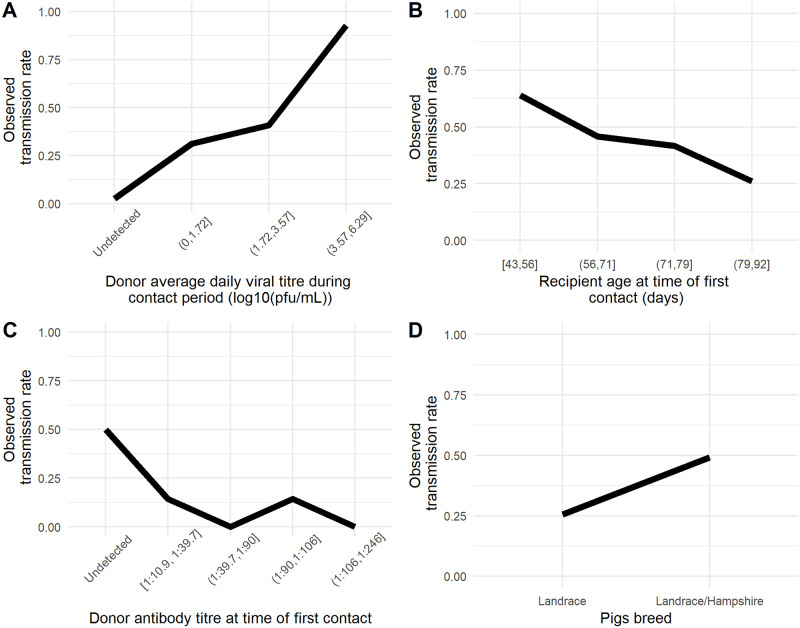
Fig 5. Probability of transmission according to each estimated effect.
A. standardized shed virus titre, B. standardized antibody titre, C. Standardized R pigs’ age at time of first contact, D. Pigs’ breed. Donors antibody titre at time of first contact binned as undetected and quartiles for detectable levels; D. Pig breed. The dots represents empirical observations, the black line represent the expected values of the posterior predictive distribution and the grey area represent the 95% uncertainty interval. The values of non-varying predictors were set as the estimated mean.

