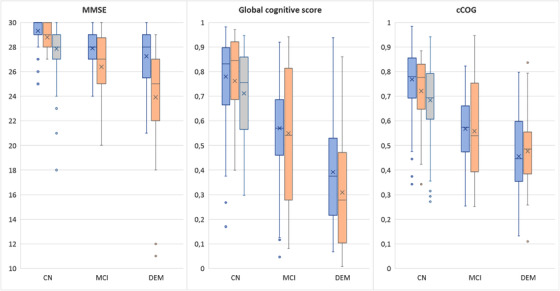
FIGURE 1.

Distributions of Mini‐Mental State Examination, global cognitive score, and computerized cognitive tool (cCOG) global score shown for different diagnostic groups of the PredictND cohort (blue), VPHDARE cohort (orange), and FINGER cohort (gray) using boxplots. For each boxplot, the line and cross indicate the median and mean values, respectively, and the bottom and top edges of the box indicate the 25th and 75th percentiles, respectively. The whiskers extend to the most extreme data points not considered outliers, and the outliers are plotted individually
