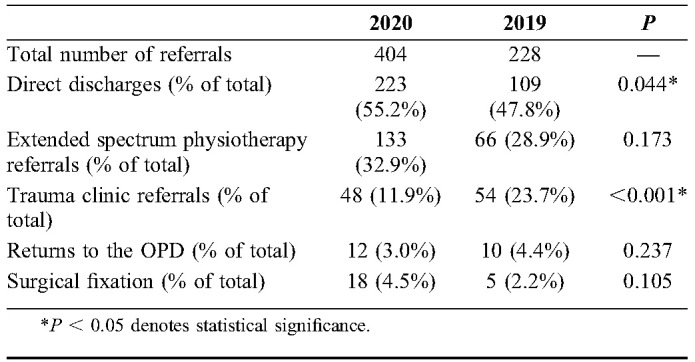
TABLE 1.
Data Comparison Between the 6-Week Time Periods of 2020 and 2019

| 2020 | 2019 | P | |
| Total number of referrals | 404 | 228 | — |
| Direct discharges (% of total) | 223 (55.2%) | 109 (47.8%) | 0.044* |
| Extended spectrum physiotherapy referrals (% of total) | 133 (32.9%) | 66 (28.9%) | 0.173 |
| Trauma clinic referrals (% of total) | 48 (11.9%) | 54 (23.7%) | <0.001* |
| Returns to the OPD (% of total) | 12 (3.0%) | 10 (4.4%) | 0.237 |
| Surgical fixation (% of total) | 18 (4.5%) | 5 (2.2%) | 0.105 |
P < 0.05 denotes statistical significance.
