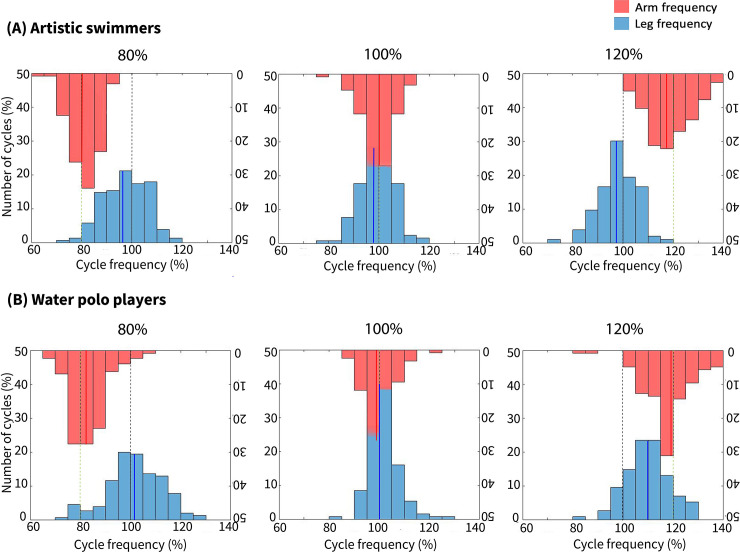
Fig 5.
Distribution of CAM and EBK frequency in artistic swimmers (A) and water polo players (B). The horizontal axis represents cycle frequency relative to the natural EBK frequency, and the vertical axis represents the number of cycles as a percentage in relation to the total number of cycles amongst all participants. Black dotted lines represent 100% of natural EBK frequency, while green dotted lines represent the metronome beat frequency. Lastly, blue and red lines represent the mean EBK and CAM frequency, respectively.

