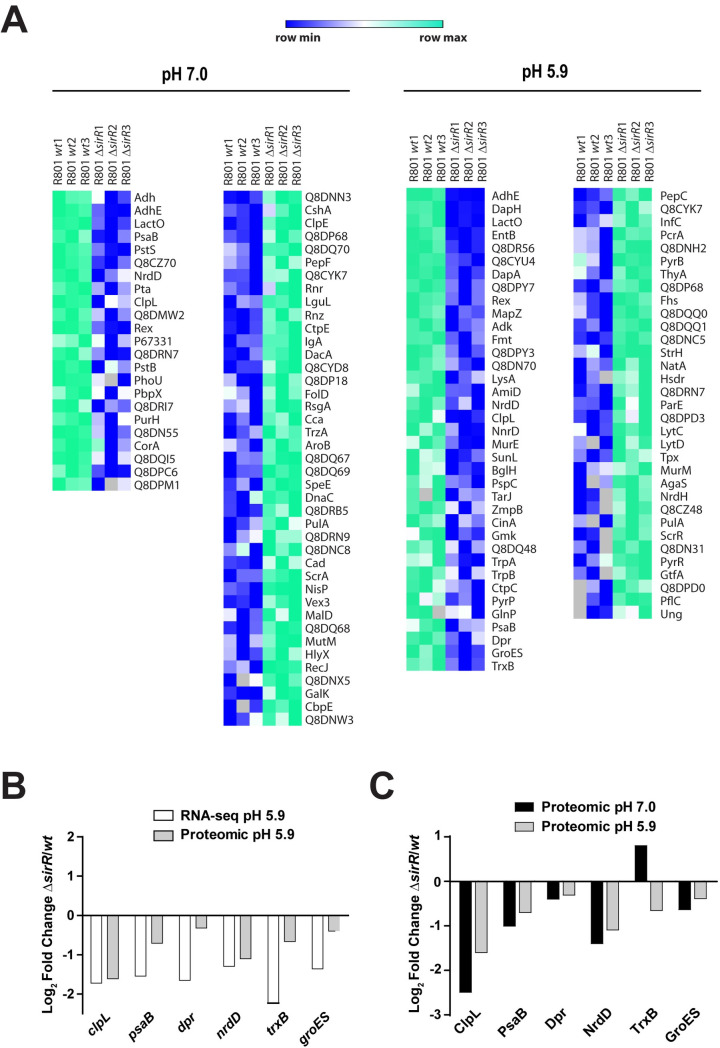
Fig 5. Comparative proteomic analysis of differentially expressed proteins in the ΔsirR and wt strains under acidic and non-stressed conditions.
(A) Heat map of proteins expressed in the ΔsirR mutant and referred to wt. Proteins with a fold change greater than 2 (less than -1 or greater than 1 on the x-axis of the graph) and a p-value < 0.05 were considered as differentially expressed. Higher expression in the wt is displayed in shades of green, and higher expression in the ΔsirR mutant (compared to wt) is showed in shades of blue. (B) Comparison between log2 folds change (ΔsirR/wt) obtained by both RNAseq (white bars) and proteomic (gray bars) analysis. (C) Comparison between log2 folds change (ΔsirR/wt) obtained by proteomic analysis at both pH 5.9 (gray bars) and pH 7.0 (black bars).

