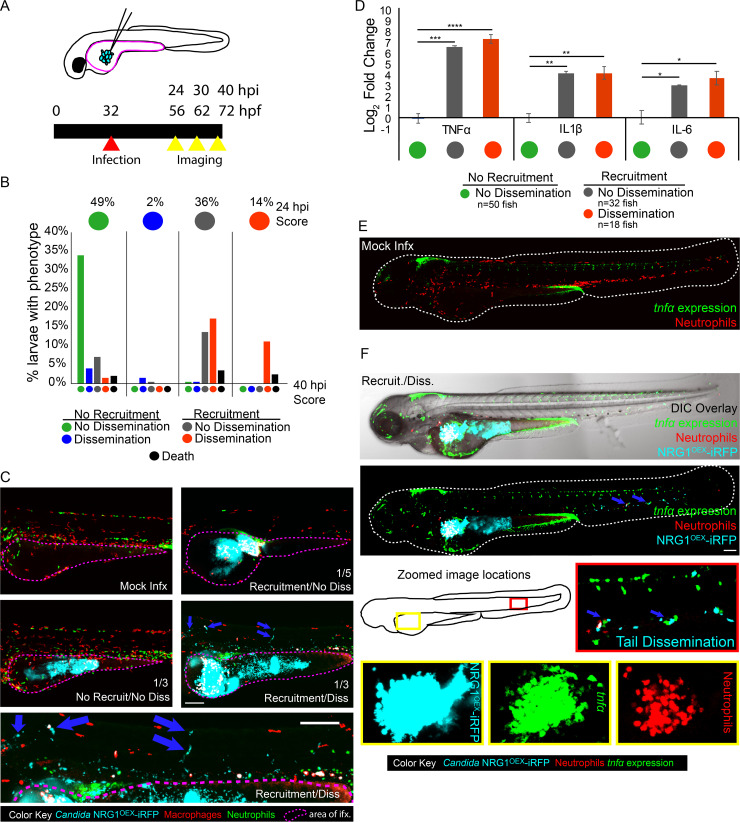
Fig 1. Macrophage and neutrophil recruitment to the site of infection is positively associated with dissemination and proinflammatory cytokine upregulation.
Larvae were infected with far-red fluorescent yeast-locked C. albicans NRG1OEX-iRFP in the yolk sac at ~32 hours post fertilization (hpf). (A) Schematic of the yolk sac injection and timeline of the infection and screening for both recruitment of phagocytes and dissemination of yeast. (B) Progression of infection where larvae with early recruitment of macrophages go on to develop disseminated infection and larvae rarely revert back to a non-disseminated state. Top circles represent the percentages of fish, by infection category, at 24 hpi, colored by recruitment/dissemination phenotype. Bottom bars represent subsequent phenotypes at 40 hpi, grouped based on their 24 hpi phenotype. Scores were pooled from larvae with fluorescent macrophages from a total of 12 experiments: 5 experiments in Tg(mpeg:GAL4)/(UAS:Kaede), 4 experiments in Tg(mpeg:GAL4)/(UAS:nfsb-mCherry), and 3 experiments in Tg(fli1:EGFP) x Tg(mpeg:GAL4)/(UAS:nfsb-mCherry). A total of 197 fish were followed from 24 to 40 hpi. (C) Examples of each infection category in Tg(mpeg:GAL4)/(UAS:nfsb-mCherry)/Tg(mpx:EGFP) larvae. The yolk sac is outlined in a dotted magenta line and the approximate proportion of larvae with this score at 40 hpi is indicated in the lower right of the image (the remainder of fish died between 24 and 40 hpi). Arrows indicate disseminated yeast in the representative image of a fish with dissemination, which is also enlarged below for clearer viewing. Scale bar = 150 μm. (D) Tg(mpeg:GAL4)/(UAS:nfsb-mCherry) larvae were scored for macrophage recruitment to the site of infection and yeast dissemination at 24 hpi, then groups of 6–10 were homogenized for qPCR. Gene expression for TNFα, IL1β, and IL-6 were measured and mock-infected larvae were used for reference. Data come from 3 independent experiments with 97 PBS larvae, 50 No recruitment/No dissemination, 32 Recruited/No dissemination, and 18 Recruited/Disseminated total larvae used for analysis. Means are shown with standard error of measurement. One-way ANOVA with Dunnett’s multiple-comparisons post-test demonstrates significantly higher gene expression in larvae with recruited macrophages at the site of infection, regardless of dissemination scores (* p≤ 0.05, ** p ≤ 0.01, *** p ≤ 0.001, **** p < 0.0001). (E-F) Representative Tg(lysC:Ds-Red)/Tg(tnfa:GFP) larvae with red fluorescent neutrophils and green fluorescence with tnfα expression in either a mock infected larvae (E) or a yeast-locked C. albicans infected fish (F). Neutrophils are recruited to the yolk sac and tnfα is expressed at the site of infection and in the tail with disseminated yeast cells (indicated with blue arrows). Scale bar = 100 μm.

