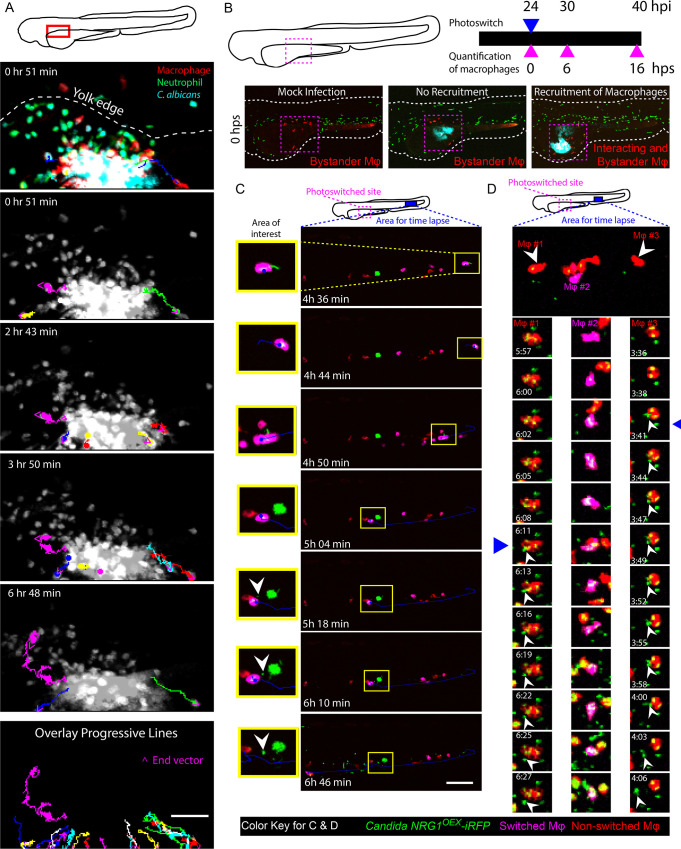
Fig 2. Phagocytes actively participate in the transport of yeast within the bloodstream.
Tg(mpeg1:GAL4/UAS:nfsb-mCherry)/Tg(mpx:EGFP) or Tg(mpeg1:GAL4)x(UAS:Kaede) larvae were infected with yeast-locked C. albicans and scored for recruitment of macrophages and dissemination of yeast at 24 hpi. (A) Neutrophils and macrophages were observed moving within and away from the infection site carrying yeast. Time-lapse taken over the course of 7 hours starting at ~32 hpi. The schematic above illustrates the area imaged. The top multicolor image shows the relative distributions of macrophages (red), neutrophils (green) and fungi (blue) and indicates the edge of the yolk with a white dotted line. In lower panels, dots and lines indicate tracks taken by phagocytes during the time lapse, with magenta arrowheads indicating the direction of movement. Phagocytes were observed taking yeast from the site of infection in these cases. The bottom panel illustrates all tracked paths from the time lapse in a single overlay image. Scale bar = 50 μm. Frames taken from S1 Movie. (B) A schematic of our macrophage photo-conversion experiments where Tg(mpeg1GAL4) x Tg(UAS:Kaede) macrophages near the infection site were photoswitched at 24 hpi, and confocal images of each photoswitched larva were taken at 24, 30, and 40 hpi to track macrophages. Macrophages near the site of infection but not interacting with yeast were identified as “bystander” macrophages. (C) Time-lapse panels of Tg(mpeg1GAL4) x Tg(UAS:Kaede) larva with a photoconverted macrophage moving out of the blood stream into tail tissue. The top schematic shows the regions used for photoswitching (magenta dashed box) at 24 hpi and the region selected for time-lapse (magenta solid box) from ~46 hpi to ~53 hpi. The yellow highlighted area demonstrates a photo-converted macrophage stopping in the bloodstream, rolling down the tail, and then releasing yeast. White arrowhead in the image panel highlights an apparent non-lytic expulsion (NLE) event. Time stamps indicate HR:MIN. Frames taken from S3 Movie. Scalebar = 100 μm. (D) (Top) Area of tail imaged by time-lapse microscopy in an independent fish from that shown in (C). White arrowheads indicate macrophages followed in detail below. (Below) Middle column of frames highlights yeast growth within a photo-converted macrophage and left and right columns of frames show apparent NLE release of yeast cells from macrophages. Time stamps indicate HR:MIN. White arrowheads within images indicate apparent NLE events. Frames are taken from S4 Movie. Scalebar = 10 μm.

