FIGURE 1.

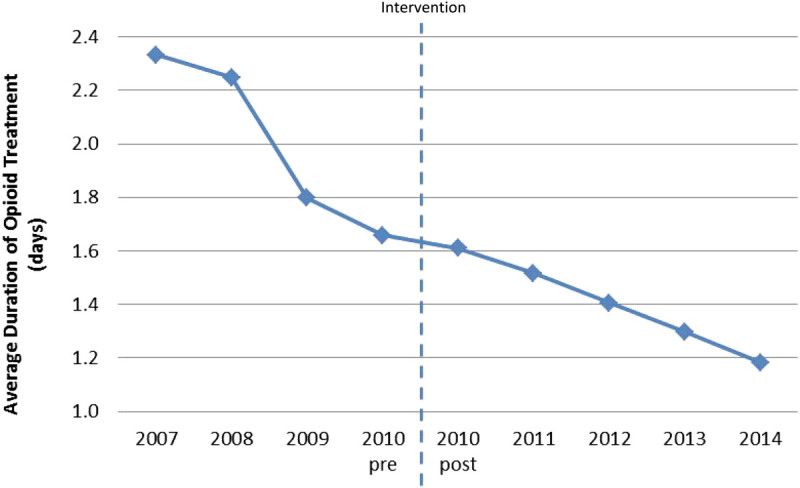
Average duration of opioid treatment among all opioid-treated patients. Dotted line indicates point at which smart infusion pump system with capnography for monitoring end tidal carbon dioxide (ETCO2) was introduced.

Average duration of opioid treatment among all opioid-treated patients. Dotted line indicates point at which smart infusion pump system with capnography for monitoring end tidal carbon dioxide (ETCO2) was introduced.