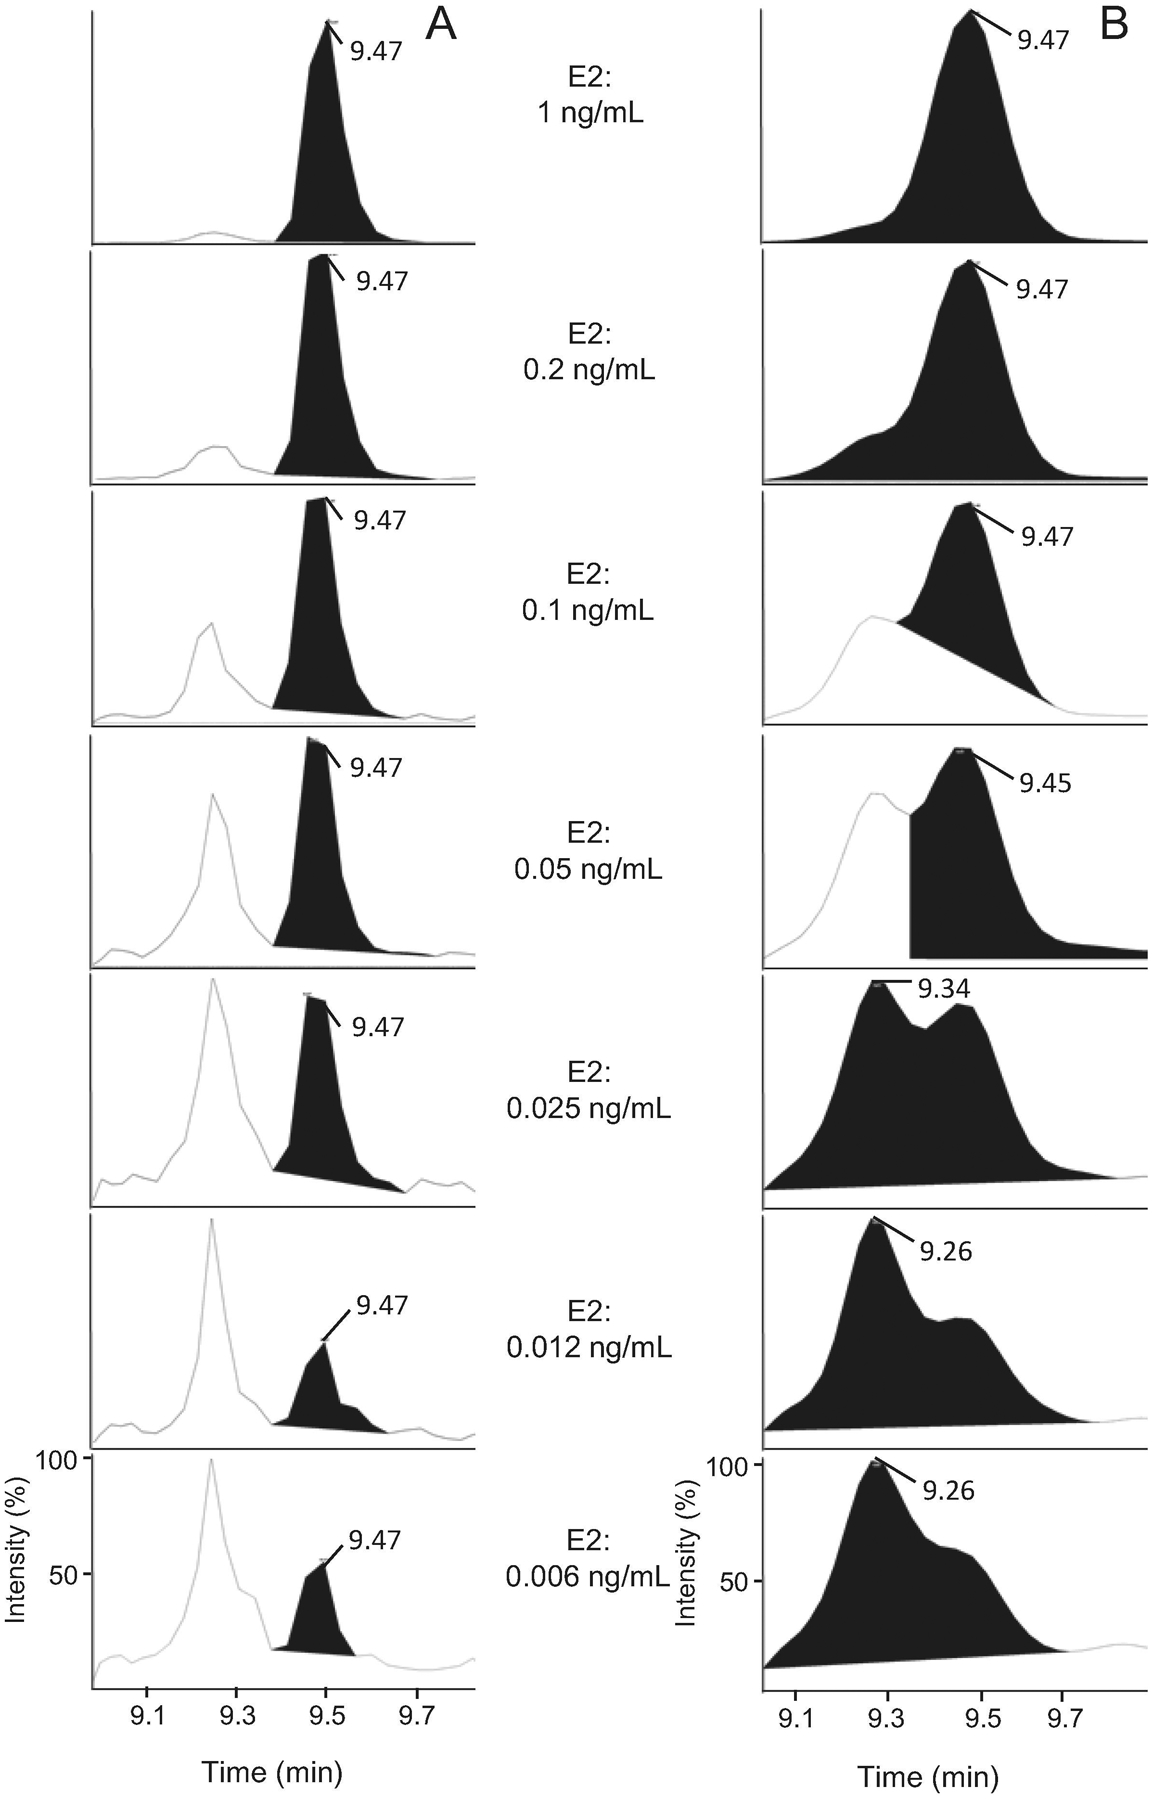
Figure 3. Effect of peak smoothing on separation of estrone (E1) and 17β-estradiol (E2).

Calibration samples were prepared by spiking working solution into serum followed by serially dilution and analyzing with LC-MS/MS. Peaks of E1 and E2 in the ranges of 1 to 0.006 ng/mL were selected and smoothing value of 0 (A) and 2 (B) were compared in MultiQuant software.
