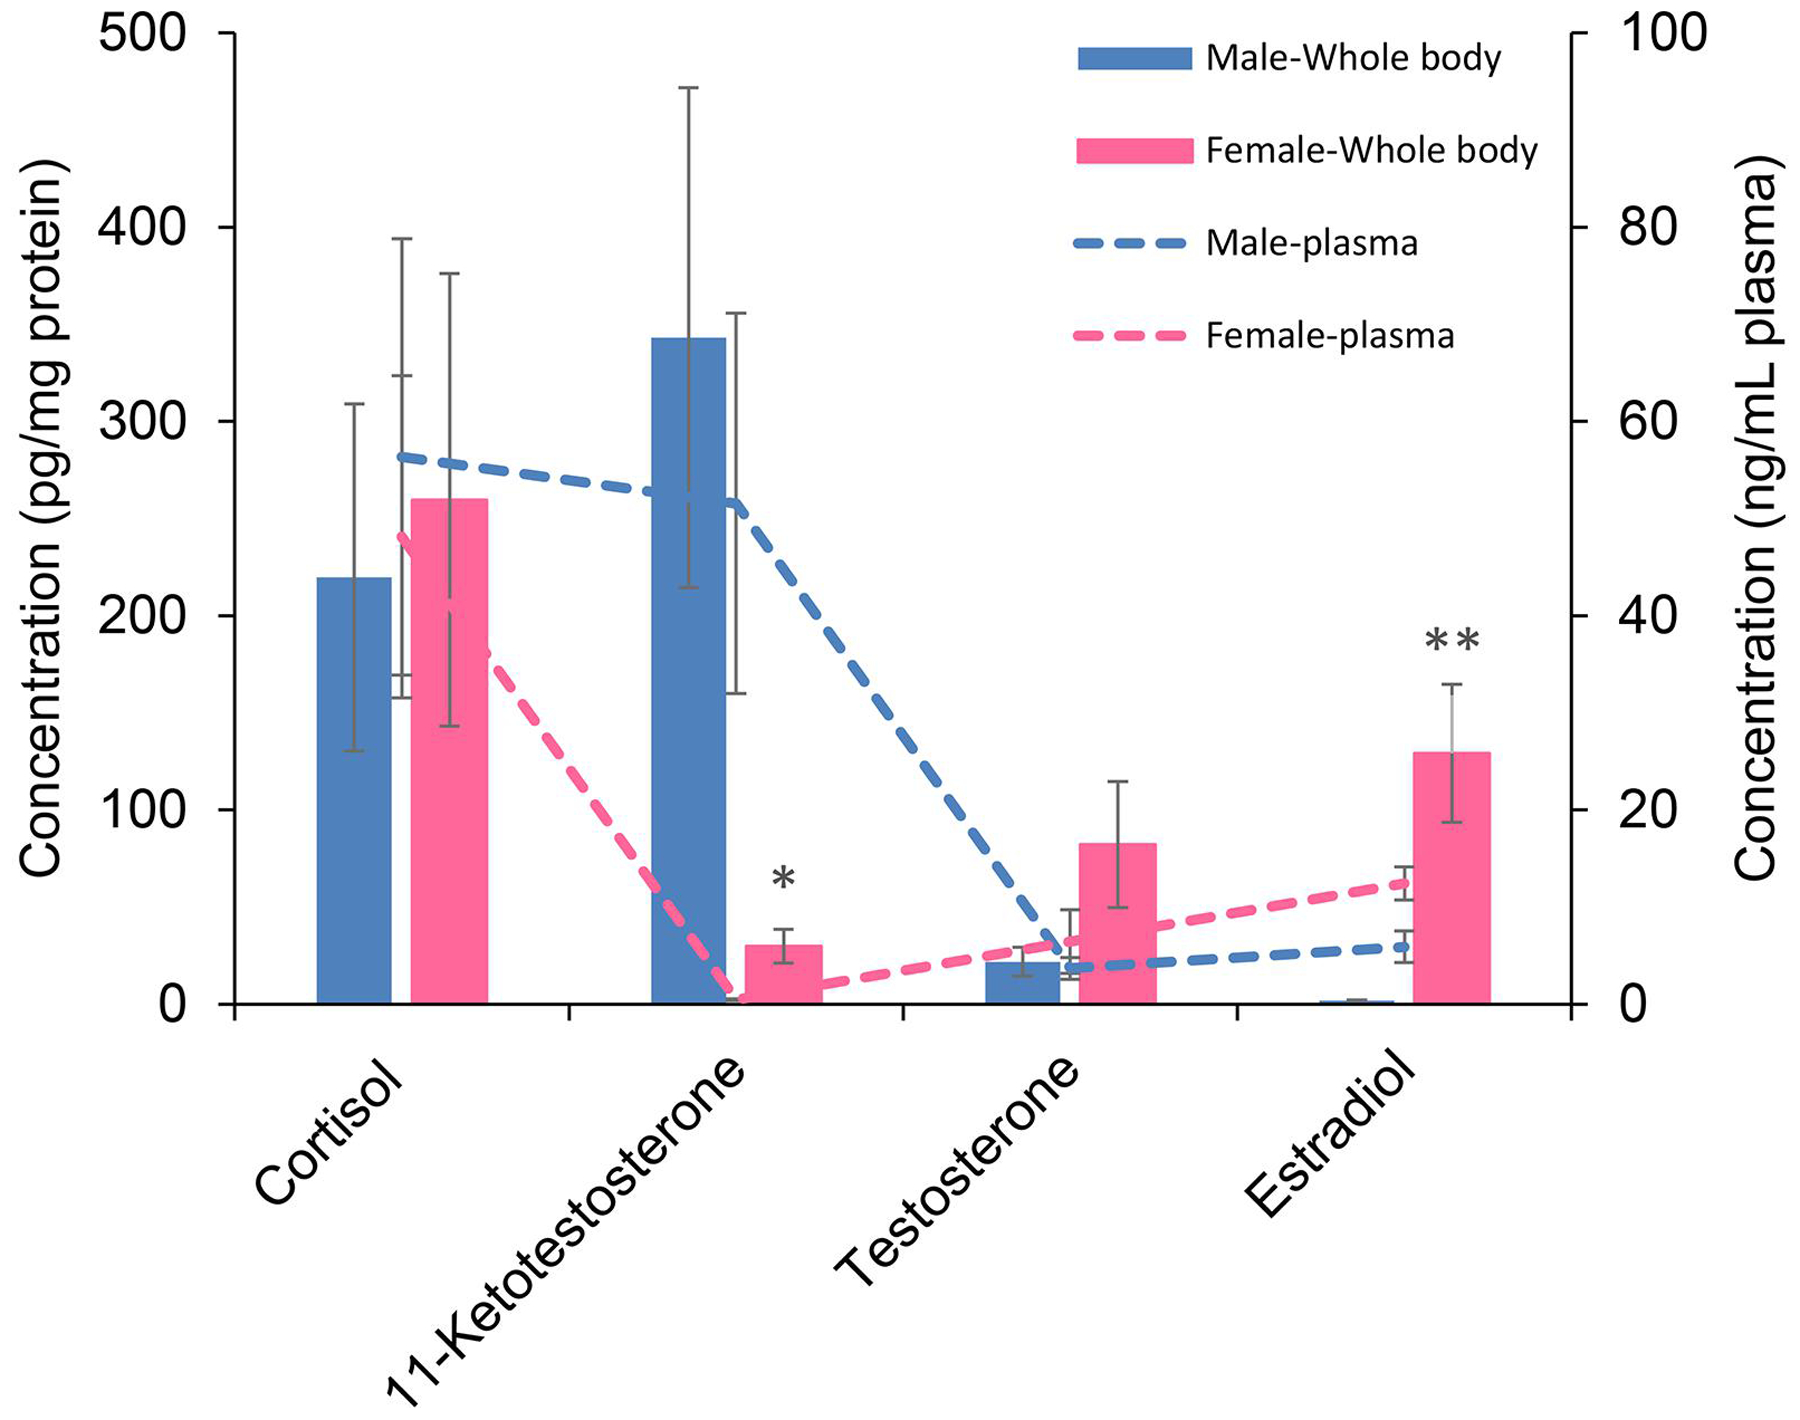
Figure 6. Concentration of hormones in FHM plasma and whole-body homogenate.

Cortisol, 11-ketotestosterone, testosterone and 17 β-estradiol, quantified in 10 μL plasma and whole body homogenate were compared in a single graph. Data are mean of four replicates of 10 μL plasma (dashed-line graph) or whole body (bar graph) ±SE. Right and left Y-axis are concentration of hormones in plasma (ng/mL) and whole body (pg/mg protein), respectively. * and ** indicate significant differences (p ≤0.05 and p ≤0.01, respectively) between male and female.
