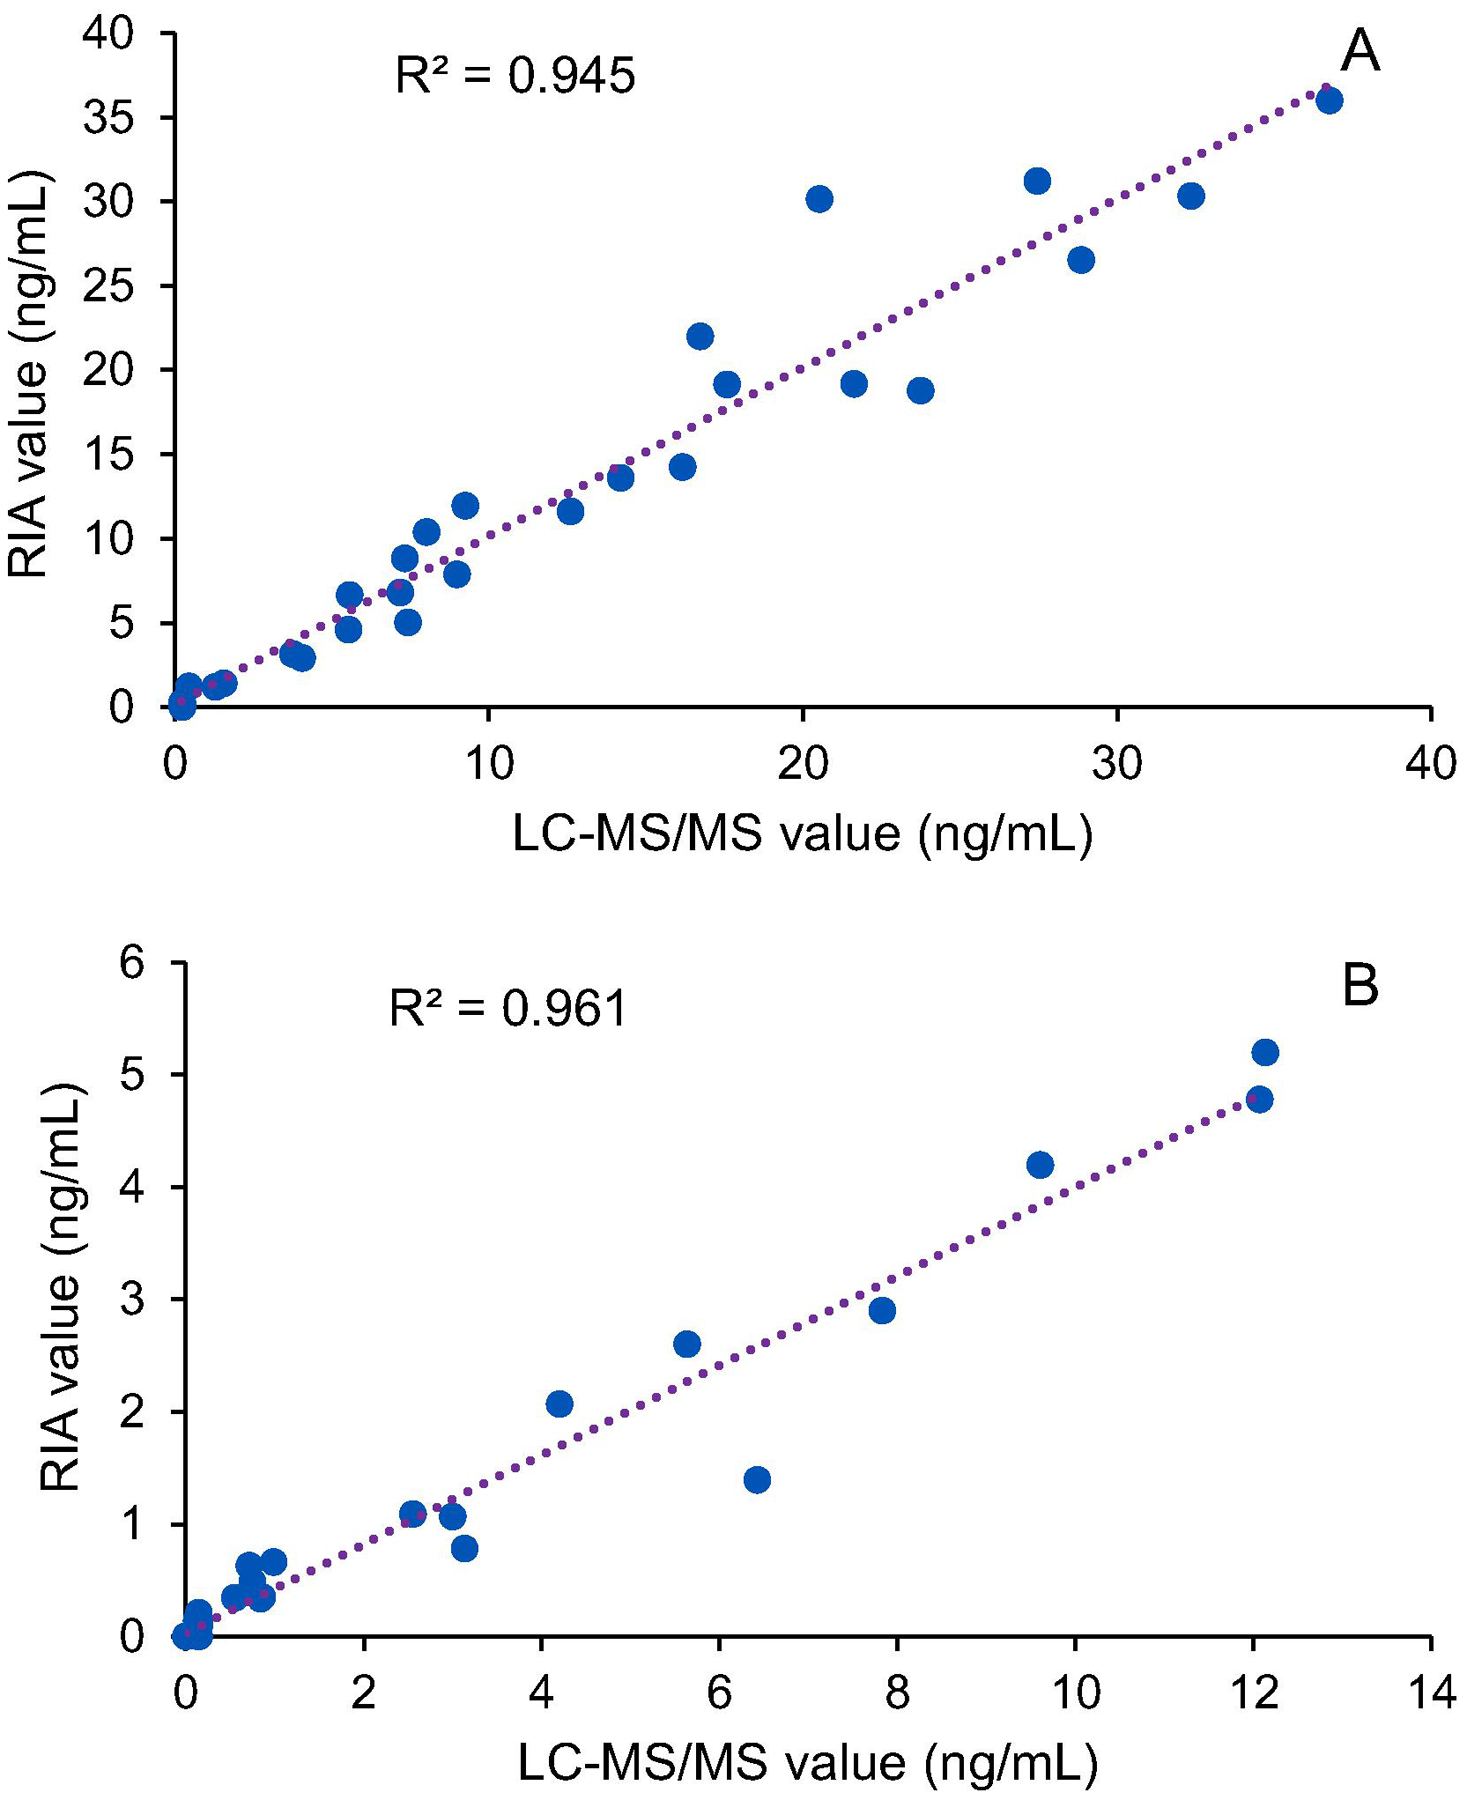
Figure 8. Comparison of the values of testosterone (T) and 17β-estradiol (E2) measured by radioimmunoassay and LC-MS/MS.

The values of T (a) and E2 (b) in male and female pallid sturgeon plasma were plotted. Data are mean of duplicates of concentration of hormones (ng/mL). Samples with not-detected E2 were removed from the plot b. R2 is the correlation coefficient of each plot.
