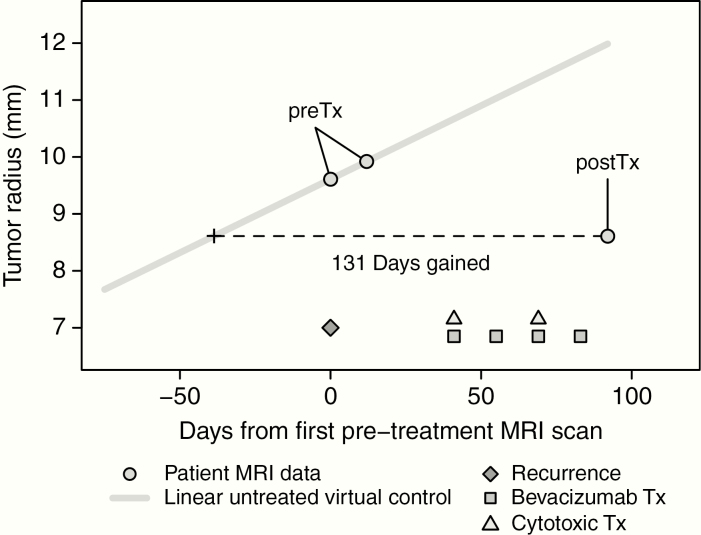
Figure 1.
Example of computing the DG metric for a BevCyto case in the recurrent setting, adapted from previously published linear DG methodology.23,24 Pretreatment (preTx, first two circles) and posttreatment (postTx, third circle) MRIs are segmented for each contrast (ie T1Gd or FLAIR). A patient-specific untreated virtual control can be calculated with preTx data (grey line). DG scores are then calculated by comparing postTx tumor size with the untreated growth rate to determine the amount of time gained or lost depending on tumor change during therapy. Timing of clinical events relative to imaging is shown at the bottom of the figure. Patients in this study received bevacizumab with or without concurrent cytotoxic therapy and were not required to have a specific number of cycles or complete therapy prior to first posttreatment imaging.

