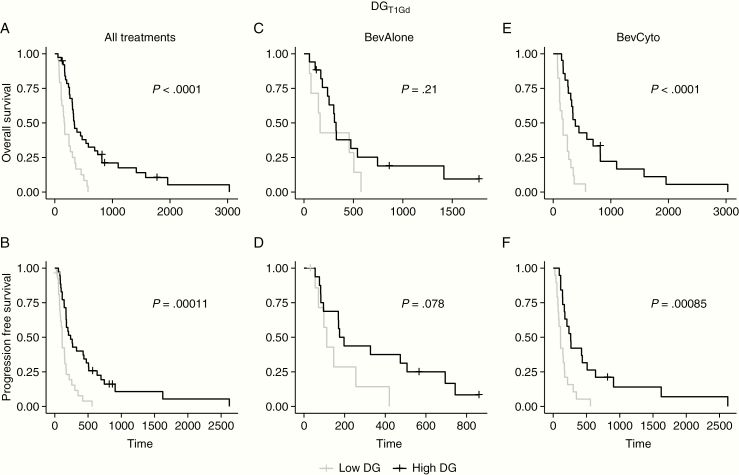
Figure 2.
Kaplan–Meier analysis of DGT1Gd using previously identified optimal DGT1Gd cutoffs24 in the complete cohort (first column, A–B) and subanalysis by treatment group (second and third columns, C–F) for OS and PFS. Prior cutoffs significantly discriminated survivor groups in the recurrent setting for OS and PFS. In further subanalysis by treatment, prior cutoffs significantly discriminated survivor groups for BevCyto patients (E–F), but not for BevAlone patients (C–D). High and Low DG groups were set based on the assigned cutoffs reported in Table 2.

