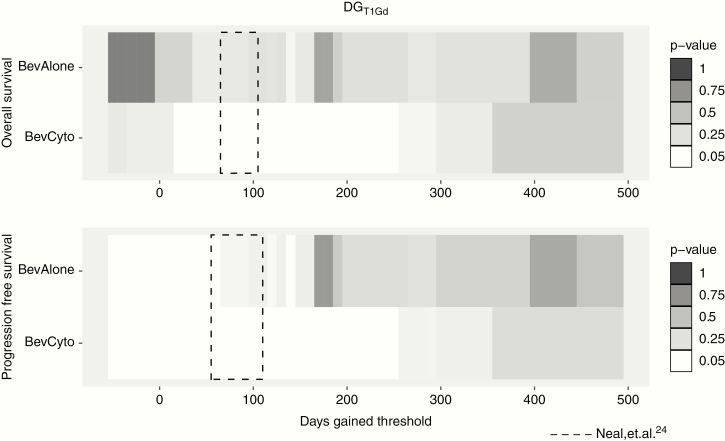
Figure 3.
Iterative Kaplan–Meier significance of DGT1Gd thresholds for OS and PFS for each therapy group (white: log-rank P ≤ .05, greys: P > .05). Significant cytotoxic therapy thresholds show substantial overlap with DG thresholds from newly diagnosed treatment analysis (dashed box24).

