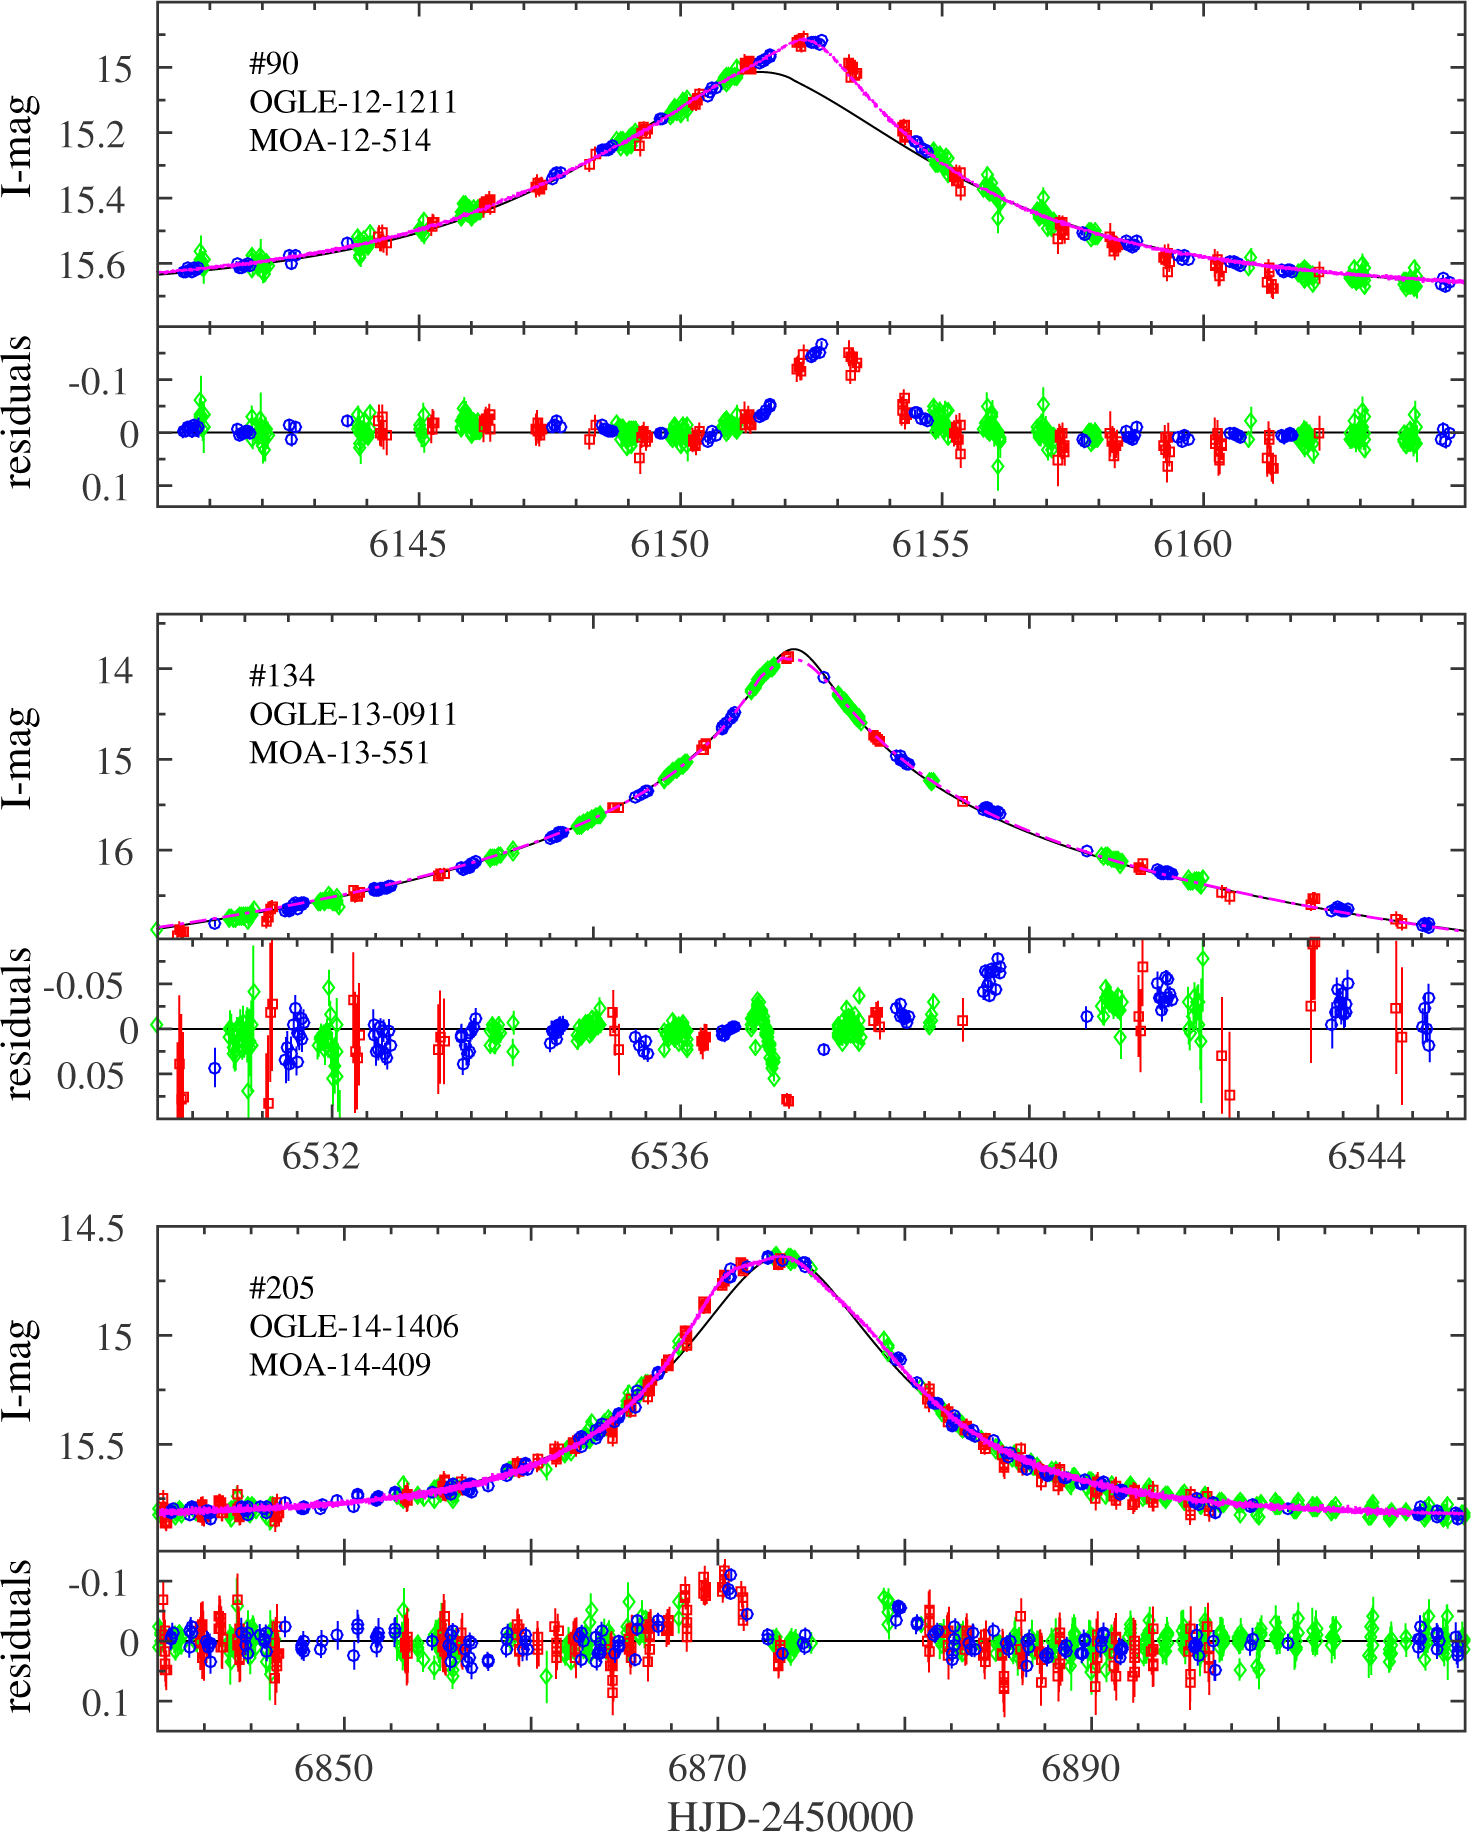
Figure 12.

Inter-calibrated light curves of three anomalous events detected by our detection filter, in addition to those detected both by eye and by the filter, and shown in Figures 5–11. The residuals from the point-lens model are shown in the lower panel of each event, revealing the anomalous region.
