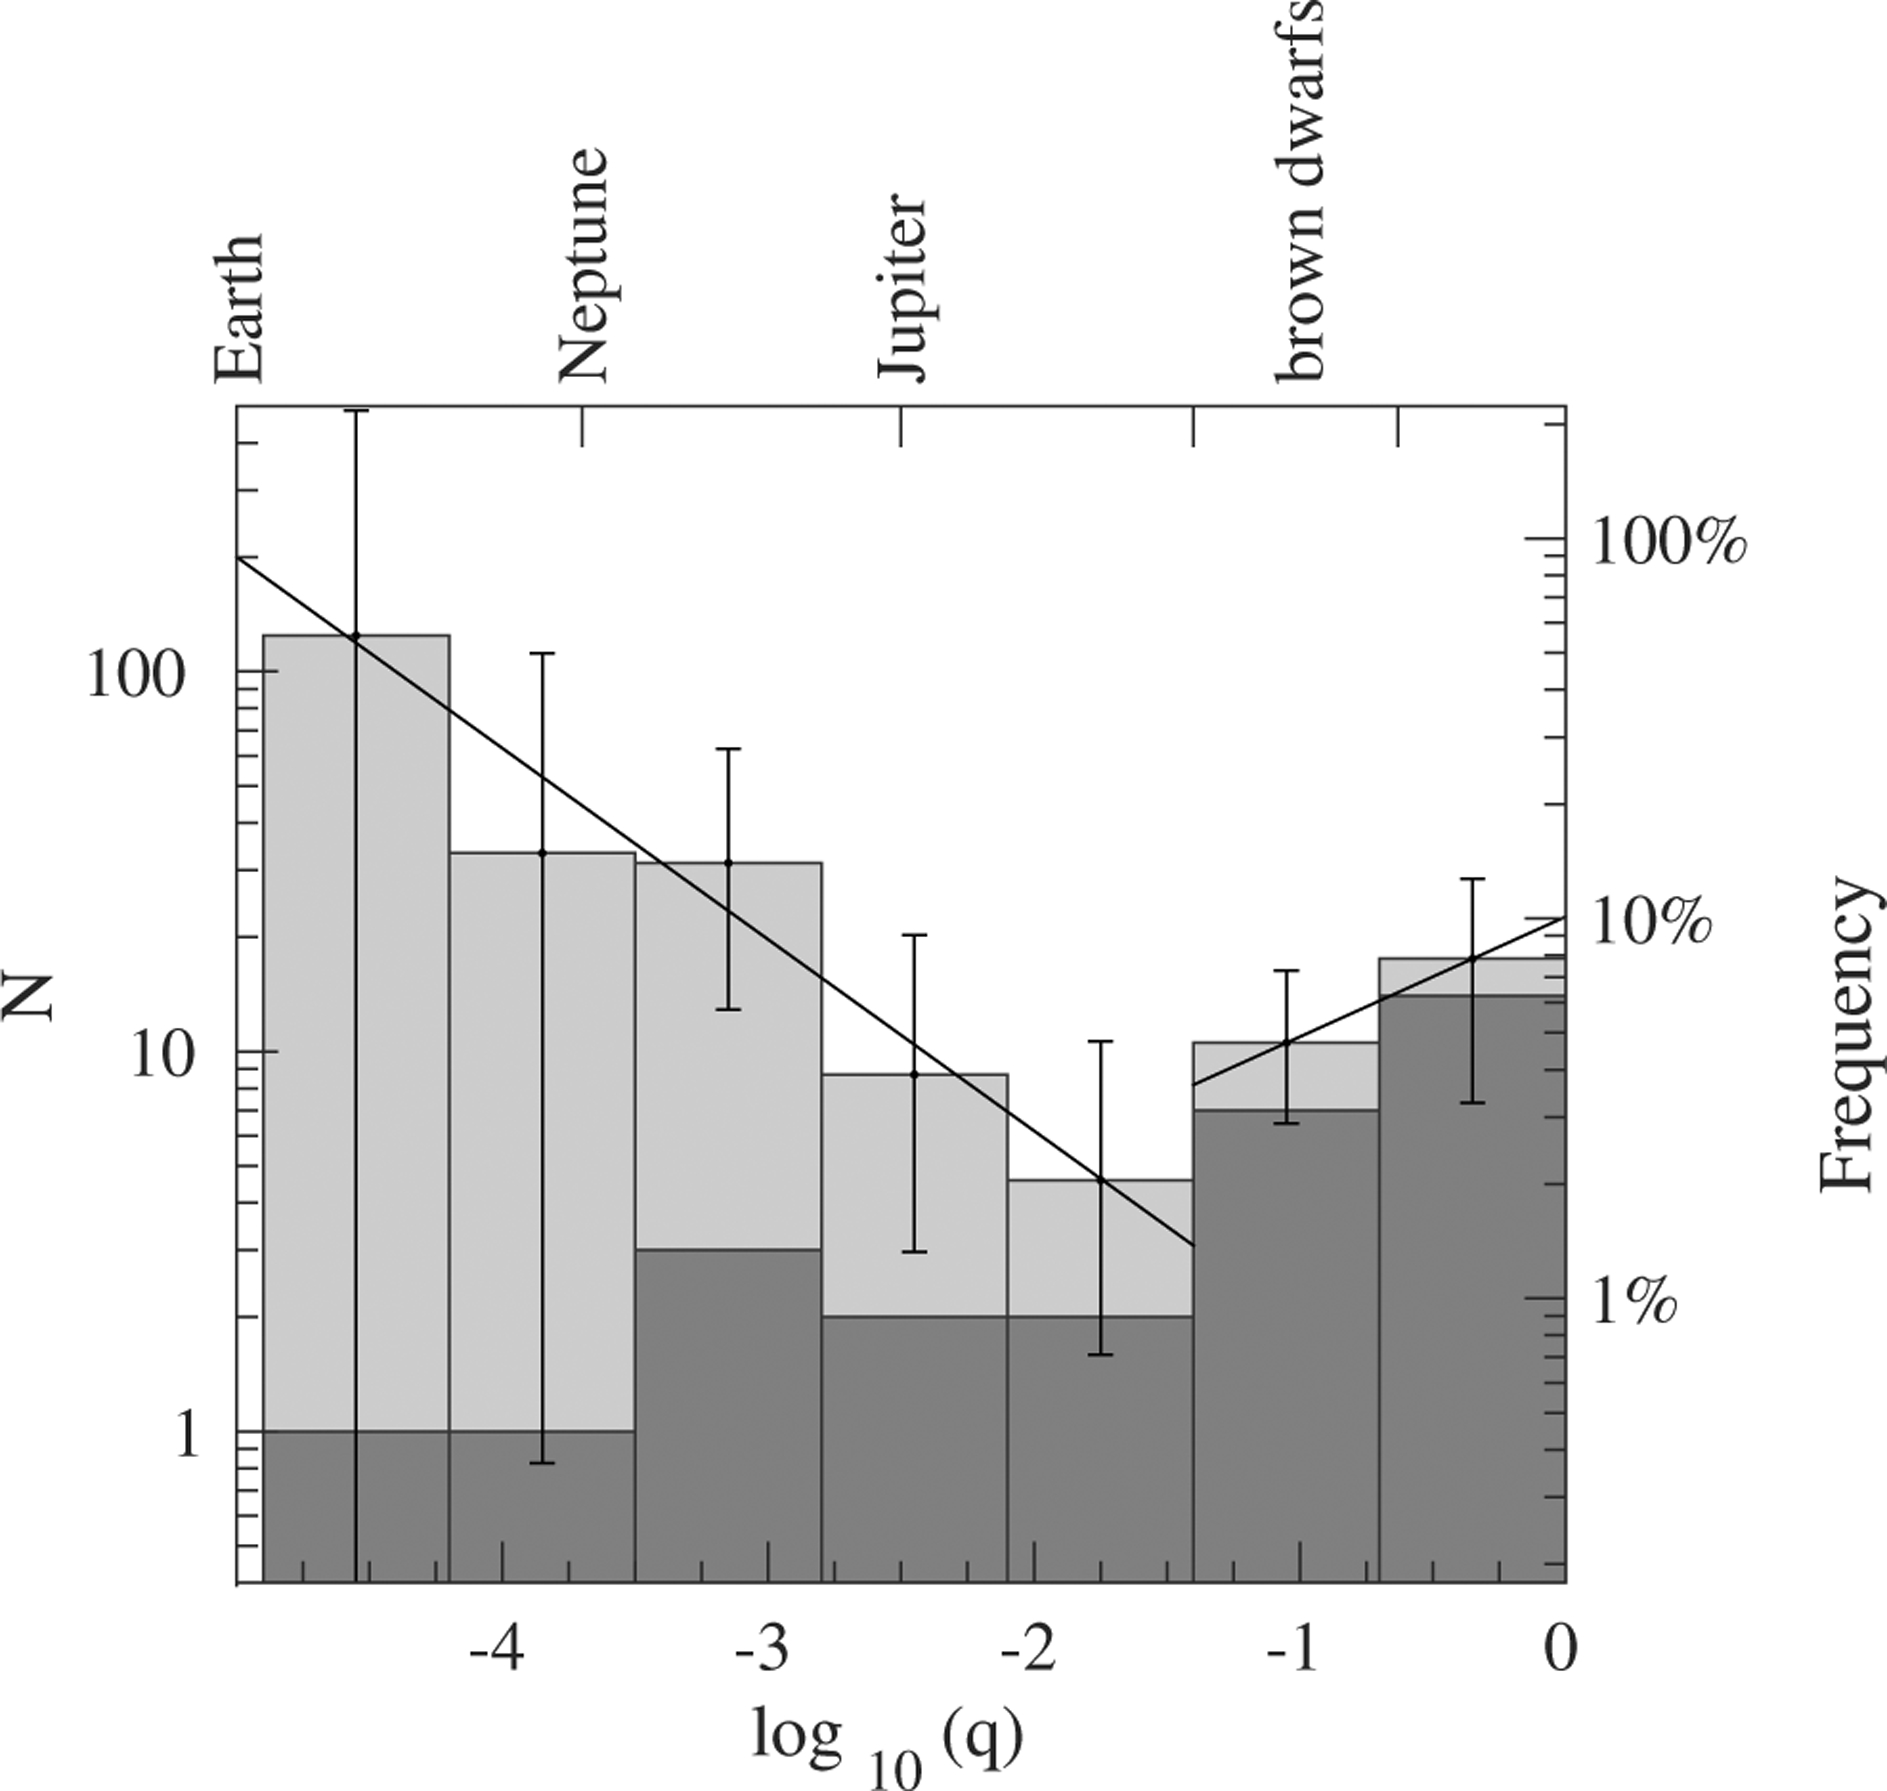
Figure 13.

The distribution of estimated mass ratios of our sample, before (dark gray) and after (light gray) correcting for detection efficiency. The right-hand vertical axis shows the corresponding frequency. The top horizontal axis indicates the masses of Earth, Neptune, Jupiter and the brown dwarf range, for a typical host mass of 0.3M⊙. The distribution hints at the existence of two populations, stellar binaries and planets, separated by a minimum that is analogous to the brown dwarf desert found by radial velocity surveys, although here the division appears to be in the super-Jupiter range. Solid lines are power laws d(log f)/d(log q) = −0.50 ± 0.17 (in the planetary regime) and d(log f)/d(log q) = 0.32 ± 0.38 (in the stellar binary regime).
