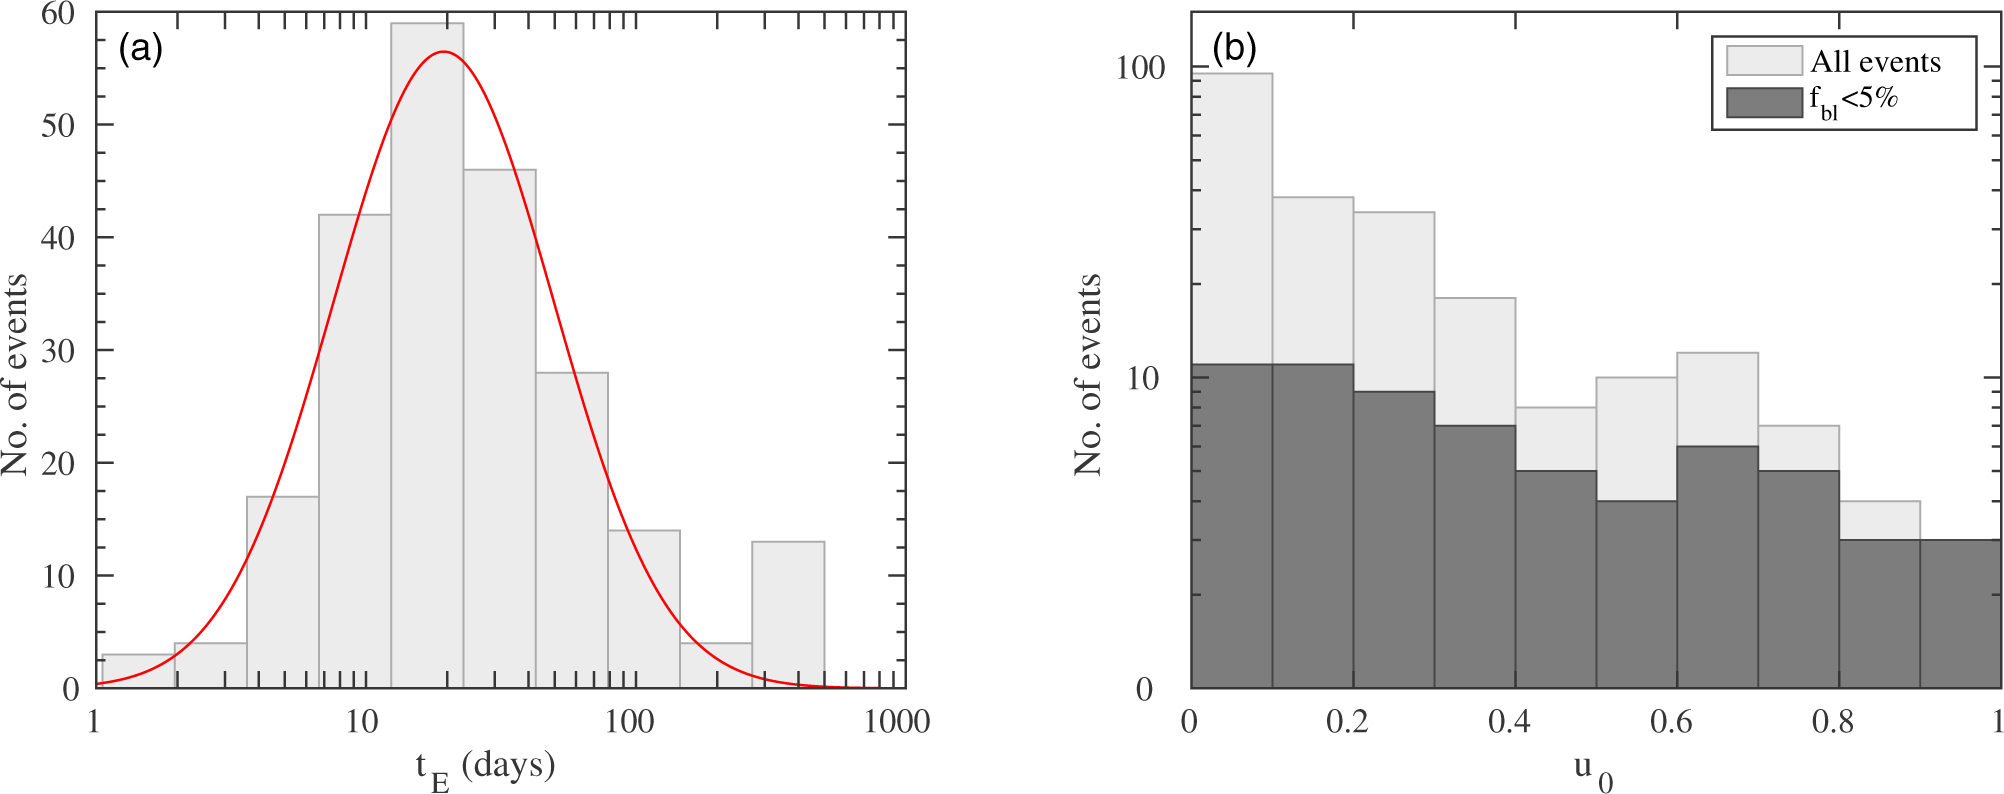
Figure 3.

Best-fit single-lens parameters for the sample of 224 lensing events: (a) Distribution of event timescale, tE. The solid curve is a lognormal fit,), , with μ = 1.29 (corresponding to 19.5 days) and σ = 0.54; (b) Distribution of impact parameter, u0 (light-gray). Due to selection favoring the detection of highly magnified faint events over weakly magnified faint events, there are more events at smaller impact parameters. The dark-gray histogram shows the distribution only for unblended (i.e. relatively bright) events, which are distributed more uniformly, as expected.
