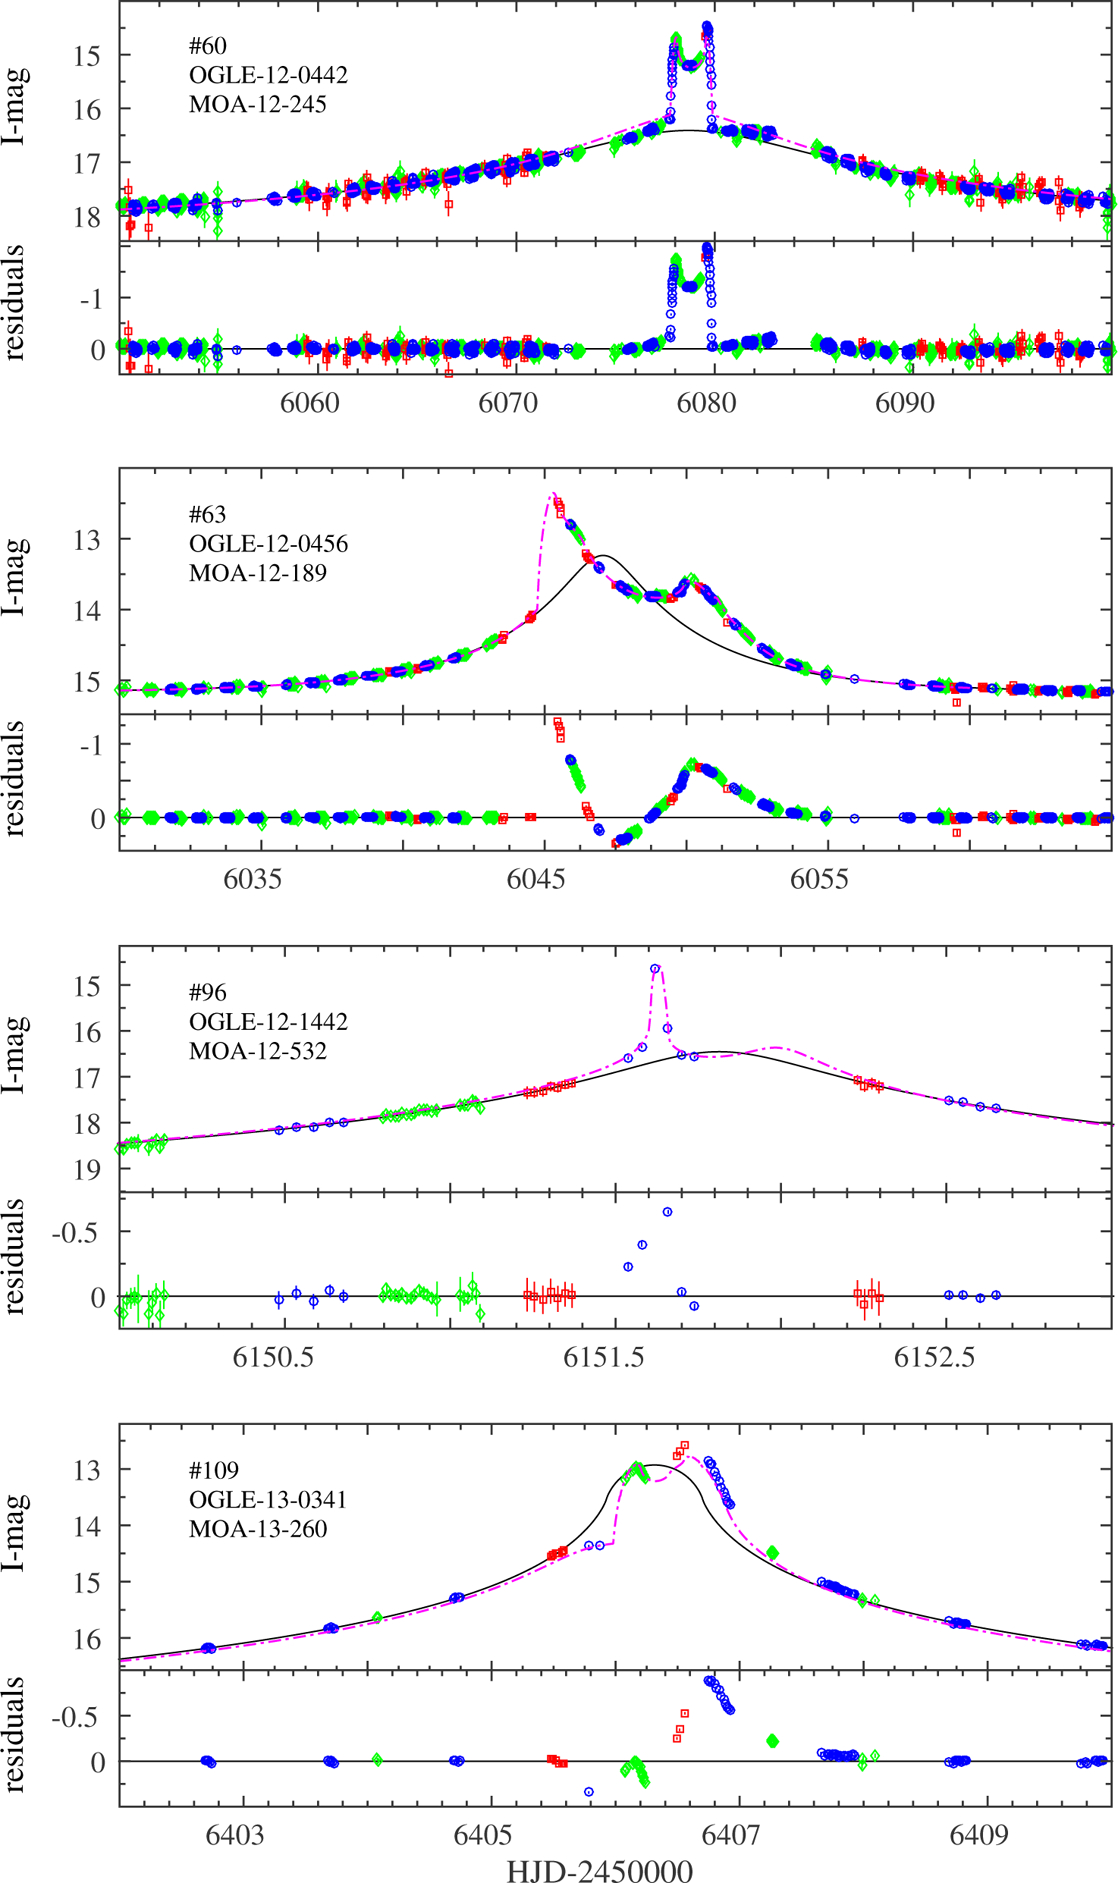
Figure 7.

Inter-calibrated light curves of events with a clear anomaly that we identify by-eye: OGLE - blue circles, MOA - green diamonds, Wise - red squares. Magenta lines are the best-fit model, either published or from the grid search. The residuals from the point-lens model are shown in the lower panel of each event. The identifying number from Appendix A is marked in the upper-left corner.
