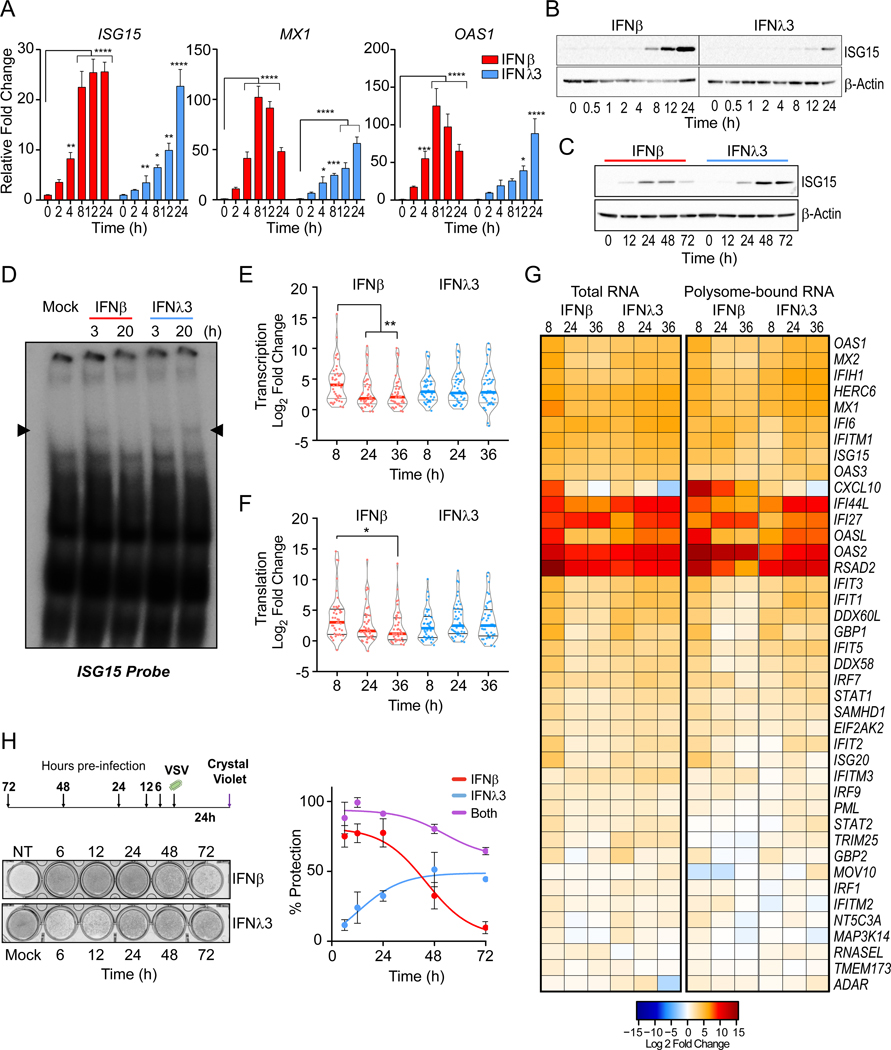
Figure 1 – The antiviral response to IFNλ is delayed relative to IFNβ.
IFN-stimulated gene (ISG) expression following IFN treatment in PH5CH8 cells. (A) Induction of ISG15, MX1, and OAS1 mRNA following IFNβ or IFNλ3 for the indicated times. Mean changes ± SD in gene expression were determined relative to mock-treated cells (value of 1) and normalized to HPRT. (B-C) Immunoblot analysis of ISG15 post IFN treatment. Statistical significance of stimulation and time-dependent gene expression changes were analyzed using two-way ANOVA. (D) EMSA with nuclear extracts from IFNβ or IFNλ3 treated PH5CH8 co-incubated with radiolabeled ISG15 ISRE probe. Data are representative of 2 independent experiments. (E) Violin plots indicate the relative mRNA expression of total RNA (F) and polyribosome associated mRNA across 41 ISGs at the indicated times post IFN-treatment. Statistical significance was determined by Mann-Whitney test. Solid bars indicate the median and quartiles. (G) Heatmap representation of log2 transformed relative expression of individual ISG mRNA after IFN treatment (left) and relative ratio of polysome-bound mRNA (right). Red color indicates increases while blue indicates a decrease in gene expression and polysome association. (H) Assessment of antiviral protection in cells preincubated with IFNβ, IFNλ3, or both for the indicated time prior to infection with VSV at a multiplicity of infection (moi) of 0.1. Schematic of experimental design and representative image of crystal violet uptake assay (top) and quantification of dye-uptake (bottom). Uninfected, untreated cells were used as negative controls (100% protection). Infected, untreated cells served as positive control (no protection). Data represents mean protection across 3 independent experiments ± SEM. Across all experiments, cells were stimulated with 25 IU/ml of IFNβ or 100 ng/ml IFNλ3. Unless otherwise indicated, data is representative of 3 independent experiments. See also Figure S1.

