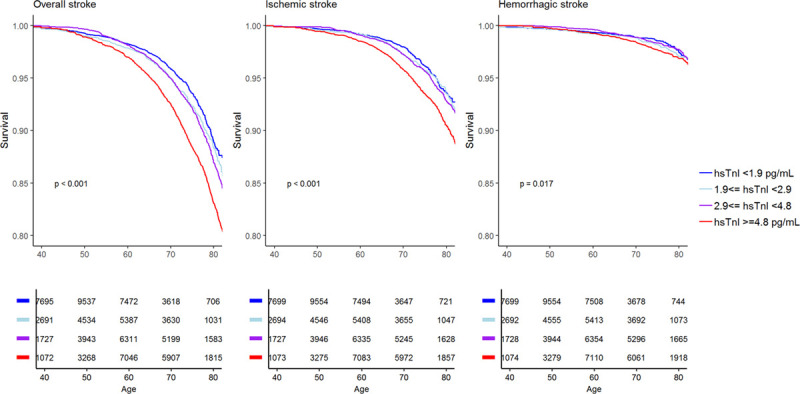
Figure 2.

Kaplan-Meier curves of stroke-free survival according to high-sensitivity cardiac troponin I (hsTnI) categories. Numbers below the curves represent individuals at risk for the different hsTnI categories at a certain age. Note that the y axes are truncated at 0.8. Given P values are for the comparison of the highest and the lowest hsTnI categories.
