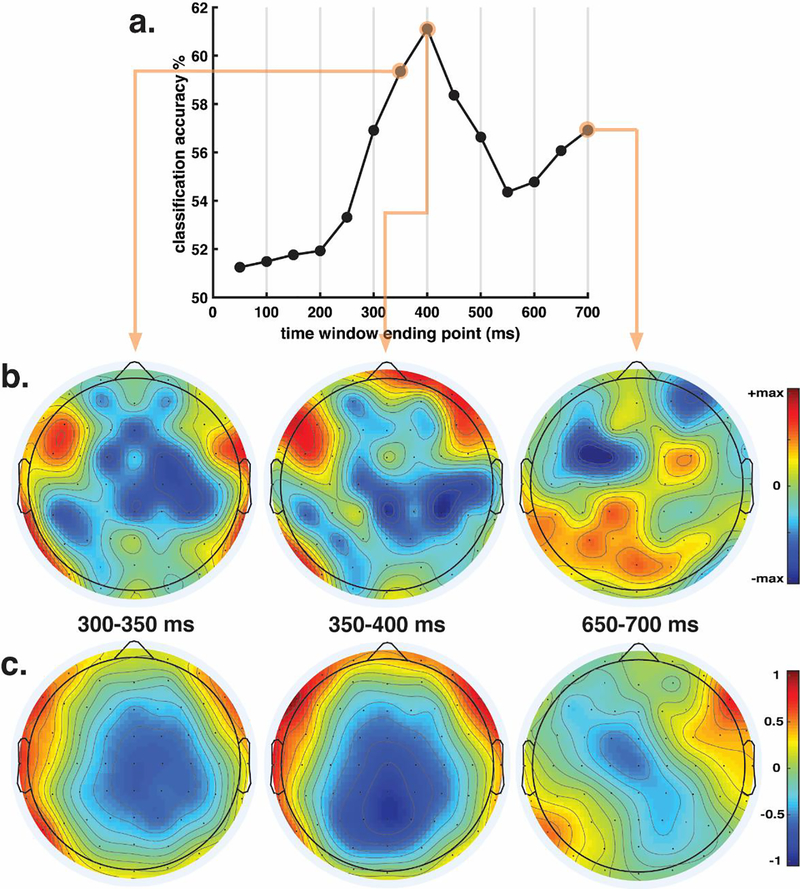
Fig. 9.
SVM time window analysis. a. Classifier performance when trained and validated on each individual time window. b. Scalp plots of the electrode weights from the highlighted windows. The max scale value for 300–350 and 350–400 is 40; the max value for 650–700 is 80. c. Equivalent grand average ERP scalp plots to the three time windows displayed in b, showing the mean voltage difference (in μV) between trials in which subjects responded “different” minus trials in which they responded “same”.

