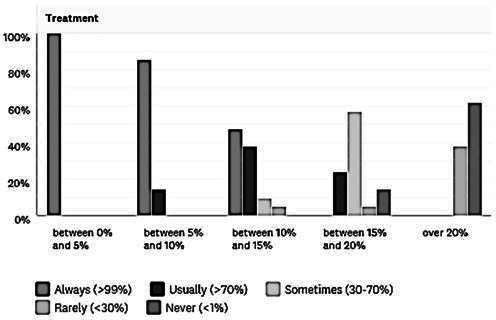
Figure 2.

Likelihood of treatment according to SeHCAT result. Percentages of respondents who would offer treatment to patients in SeHCAT categories of ‘between 0% and 5%’, ‘between 5% and 10%’, ‘between 10% and 15%’, ‘between 15% and 20%’ and ‘over 20%’ are shown. Respondents were asked to classify their likelihood of treatment as ‘always’ (>99%), ‘usually’ (>70%), ‘sometimes’ (30%–70%), ‘rarely’ (<30%) or ‘never’ (0%).
