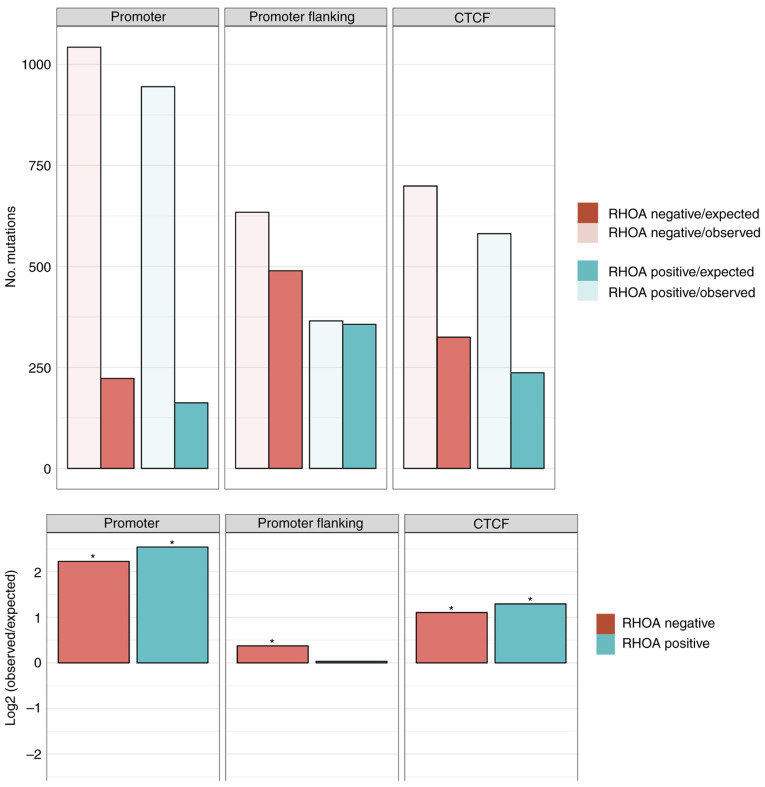
Figure 1.
Enrichment/depletion analysis of the mutational burden in defined genomic regions for the RHOA positive (green) cases vs. RHOA negative (red) cases with the number of observed mutations (transparent) vs. the number of expected mutations (solid) in the upper panel. The ratio of observed/expected on a log2 rank is depicted in the lower panels of the figure and an asterisk indicates significance (P<0.05; two-sided binomial test). AITL, angioimmunoblastic T-cell lymphoma; RHOA, ras homolog family member A.

