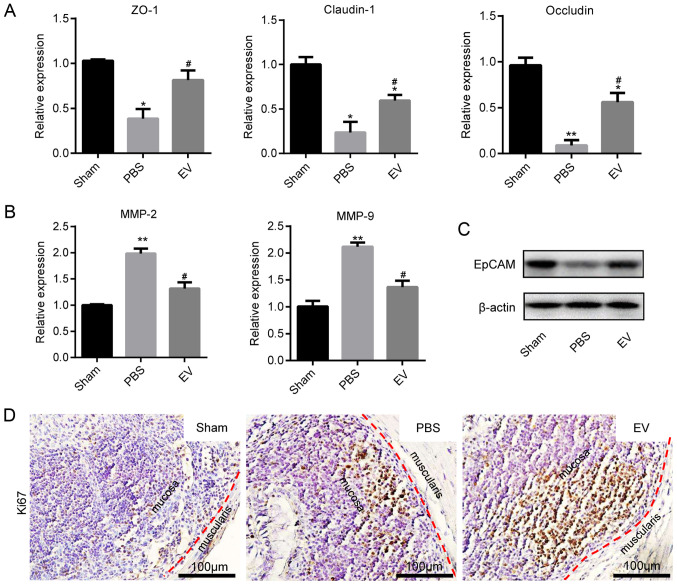
Figure 6.
Promoting the proliferation of IECs and maintaining tight junctions. (A) The expression of tight junction proteins (Claudin-1, ZO-1 and Occludin) was measured by RT-qPCR. (B) The expression of matrix metalloproteinase (MMP-2 and MMP-9) was measured by using RT-qPCR. Data are expressed as the means ± SD. *P<0.05, **P<0.01 vs. sham group; #P<0.05 vs. PBS group. (C) The protein level of EpCAM was measured by western blot analysis (D) Representative images of immunohistochemical staining of Ki67 in the colon tissues of mice in sham, PBS and EV groups; (n=8). Scale bar, 100 µm. The specific positive coloration of Ki67 is shown in brown. EVs, extracellular vesicles.

