
Figure 3.
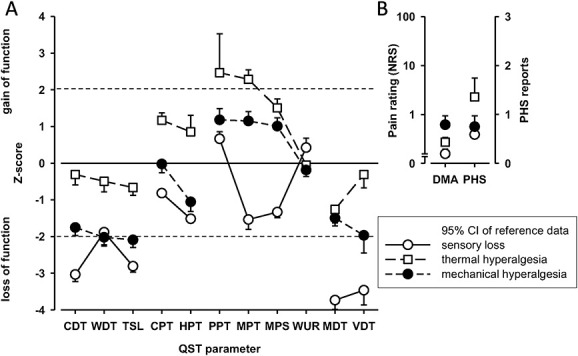
Lab-QST clusters. (A) Displayed are the frequencies (%) of abnormal values and, (B) the z-values as compared to normative DFNS data. Cluster 1 (sensory loss) (n = 34), cluster 2 (thermal hyperalgesia) (n = 14), cluster 3 (mechanical hyperalgesia) (n = 25). The dotted gray line represents ±1.96 SDs from the mean of corresponding normative values of the age-, sex-, and location-matched DFNS database. All z-values <1.96 represent a loss of function, all z-values >1.96 indicate a gain of function. CDT, cold detection threshold; CPT, cold pain threshold; DMA, dynamic mechanical allodynia; HPT, heat pain threshold; lab-QST, lab-Quantitative Sensory Testing; MDT, mechanical detection threshold; MPT, mechanical pain threshold; MPS, mechanical pain sensitivity; PHS, paradoxical heat sensation; PPT, pain pressure threshold; TSL, thermal sensory limen; VDT, vibration detection threshold; WDT, warm detection threshold; WUR, wind-up ratio.