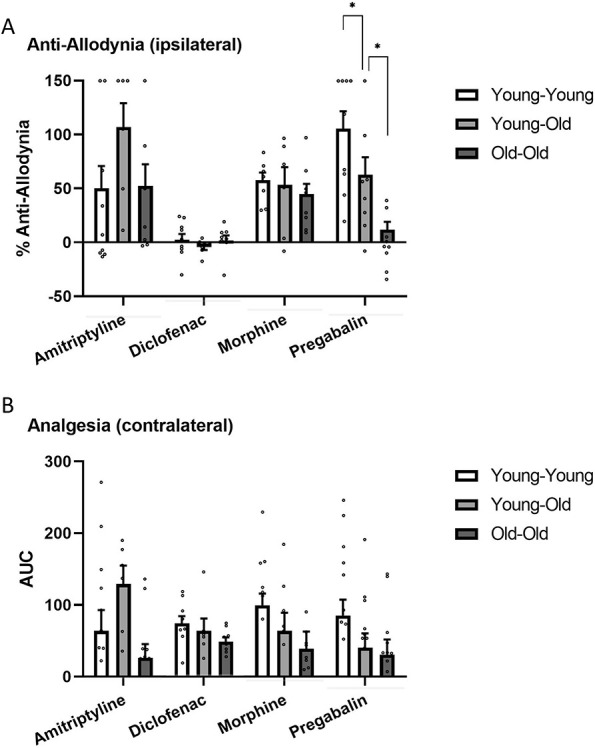
Figure 5.

Drug effects on the ipsilateral (A, antiallodynia) and contralateral (B, analgesia) hind paws in all conditions. Bars represent mean ± SEM % antiallodynia (A) or AUC (B); see section 2.6. *P < 0.05 as indicated. AUC, area under the drug-treated threshold × time curve.
