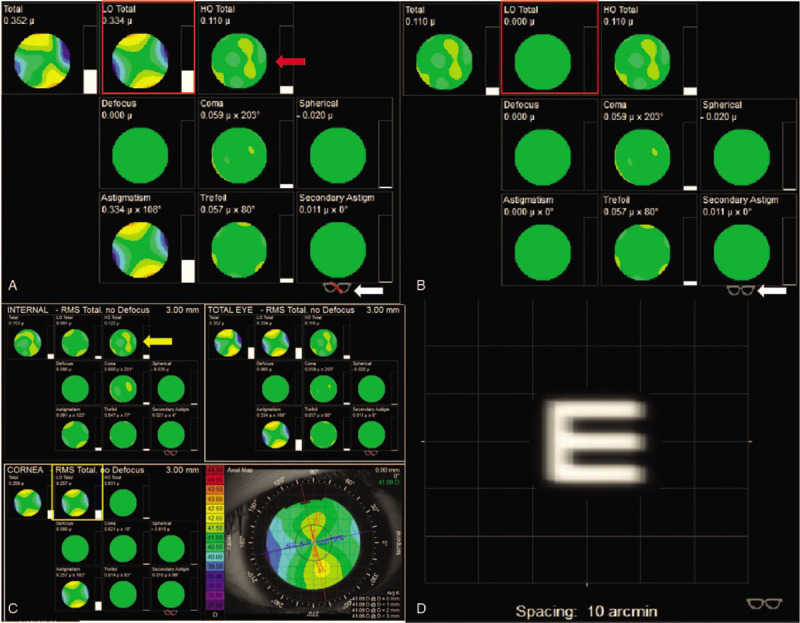
Figure 7.

The iTrace report 1 month after operation. (A) Shows the status of correcting defocus (highmyopia), marked by the white arrow. Total low-order aberrations (LOA) was 0.334, indicated by the red square; and total high-order aberrations (HOA) was 0.110, indicated by the red arrow. (B) Shows the status of correcting total LOA, indicated by the white arrow. Total LOA was 0, indicated by the red square. (C) Shows the total LOA mainly derived from the cornea, indicated by the yellow square. The total HOA mainly derived from intraocular variation is indicated by the yellow arrow. (D) Shows the clear visual quality of correct LOA achieved by wearing glasses.
