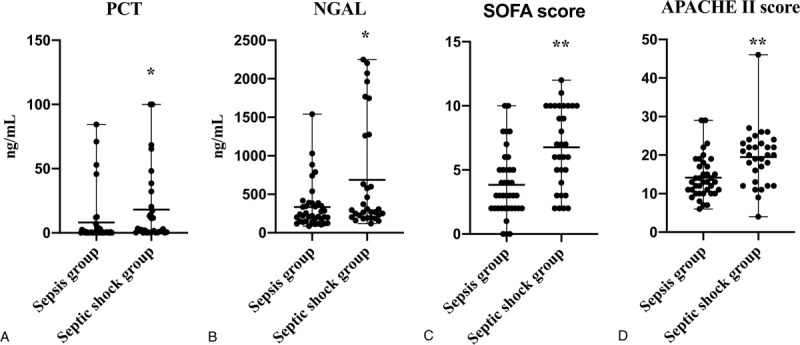
Figure 4.

Distribution of the PCT (A), NGAL (B) levels and SOFA score (C), APACHE II score (D) for sepsis group versus septic shock group. ∗P < .05 Compared with sepsis group; ∗∗P < .01 Compared with sepsis group. Between the sepsis group and septic shock group, PCT, NGAL levels and SOFA score, APACHE II score were significantly higher in septic shock group compared with sepsis group (P < .05). APACHE = acute physiology and chronic health evaluation, NGAL = neutrophil gelatinase-associated lipocalin, PCT = procalcitonin, SOFA = sequential [sepsis-related] organ failure assessment.
