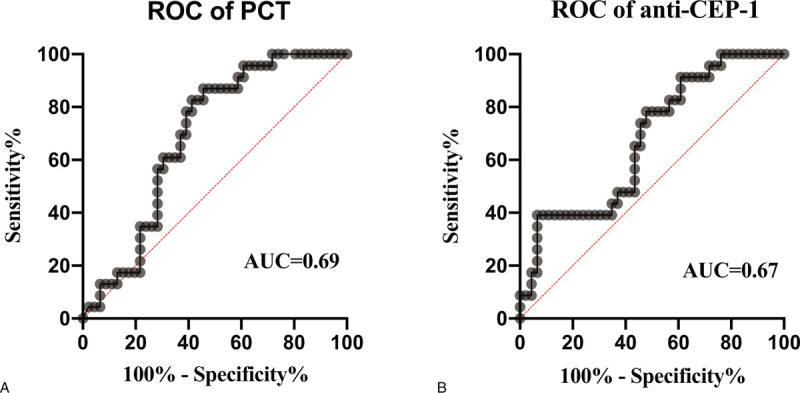
Figure 8.

ROC curves used to predict 28-d mortality for sepsis patients based on the concentrations of PCT (A) and anti-CEP-1 (B). According to mortality at 28 d of hospital stay, PCT and CEP-1 antibody had discriminatory performance with an AUC of (0.69, 0.67, respectively). AUC = area under the receiver operator characteristic curve, CEP-1 = citrullinated alpha enolase peptide-1, PCT = procalcitonin, ROC = receiver operator characteristic.
