Figure 2.

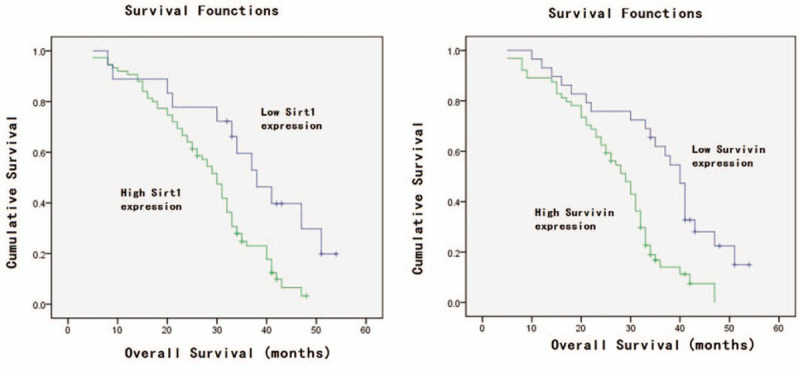
Kaplan–Meier curves for progression-free survival stratified by sirtuin type 1 (SIRT1) and survivin expression. A, SIRT1; B, survivin; and C, SIRT1 and survivin.

Kaplan–Meier curves for progression-free survival stratified by sirtuin type 1 (SIRT1) and survivin expression. A, SIRT1; B, survivin; and C, SIRT1 and survivin.