
Figure 1.
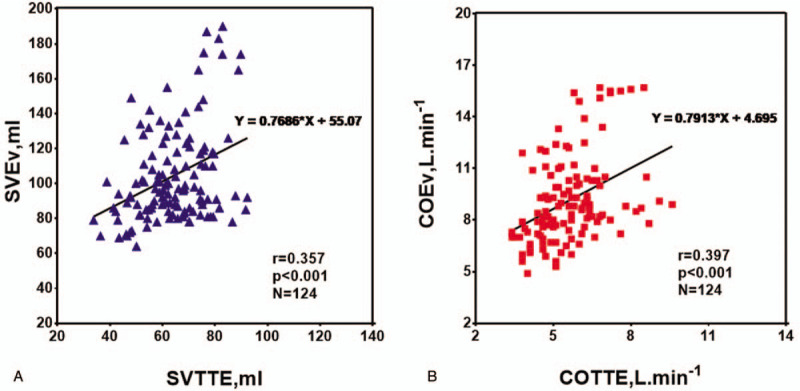
Linear regression analyses for repeated measurements between stroke volume (SV, blue triangles; A) and cardiac output (CO, red squares; B) measurements obtained with electrical velocimetry (SVEv, COEv) and transthoracic echocardiography (SVTTE, COTTE). The continuous dark lines correspond to the fitted straight line.