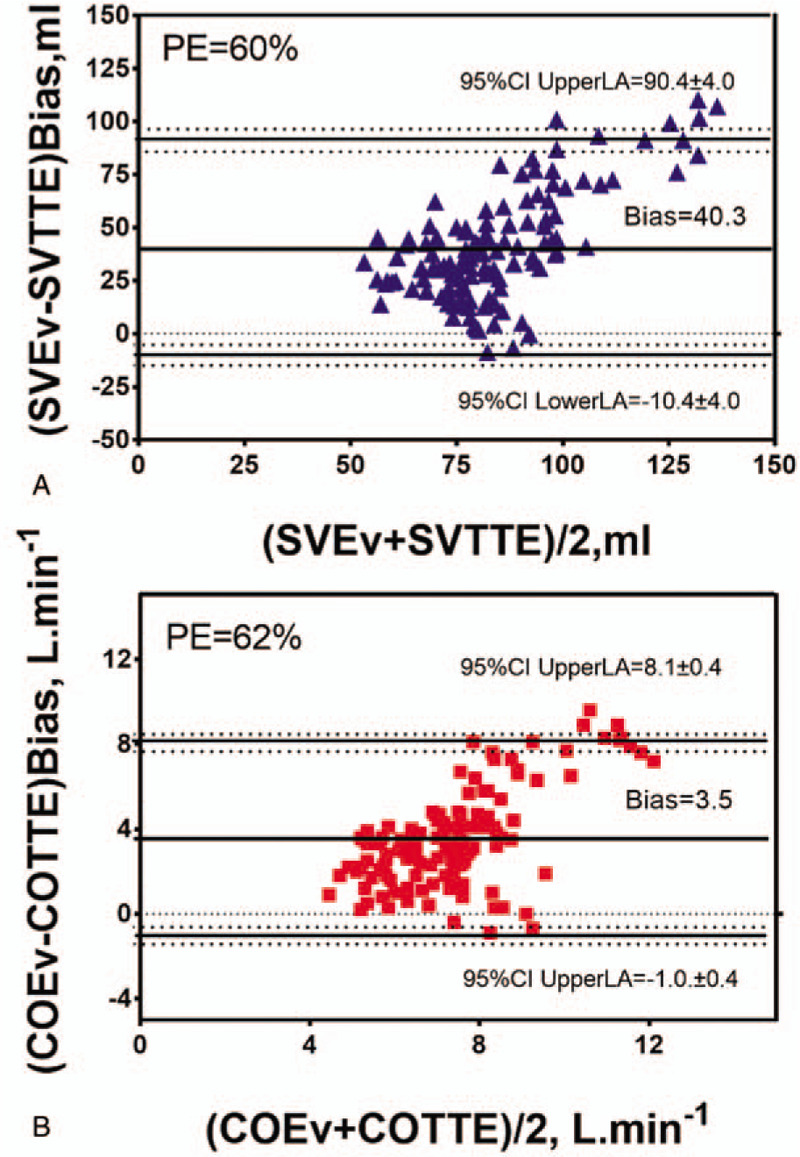
Figure 2.

Bland-Altman plots for repeated measurements between stroke volume (SV, blue triangles; A) and cardiac output (CO, red squares; B) measurements obtained with electrical velocimetry (SVEv, COEv) and transthoracic echocardiography (SVTTE, COTTE). The continuous lines correspond to the mean difference (bias), the dashed lines correspond to the 95% limits of agreement (LA), and the dotted lines correspond to the 95% confidence interval of the upper and lower LA. PE indicates percentage error.
