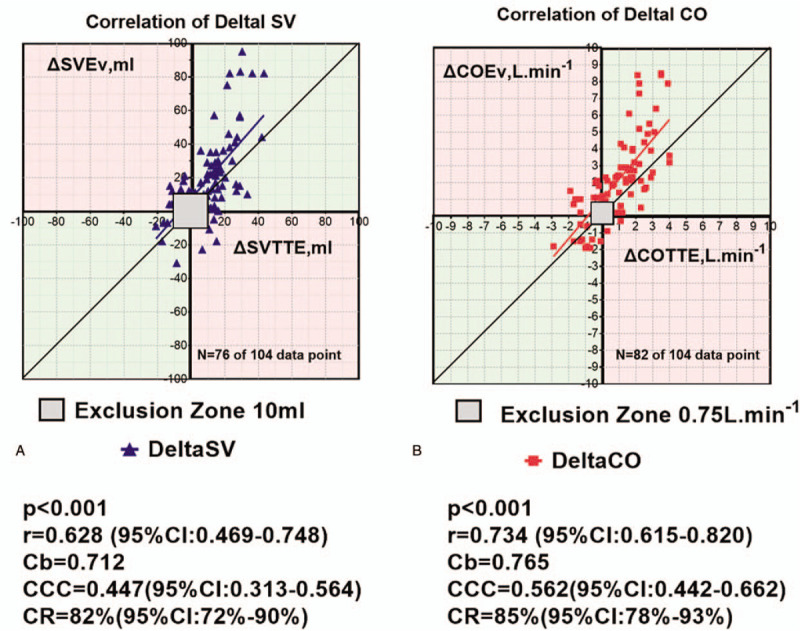
Figure 3.

Four-quadrant plot for repeated measurements shows changes in stroke volume (ΔSV, blue triangles; A) and cardiac output (ΔCO, red squares; B) with electrical velocimetry (ΔSVEv, ΔCOEv) compared to changes in transthoracic echocardiography (ΔSVTTE, ΔCOTTE). Exclusion zone, set at 10 ml and 0.75 L min−1, is shown. Regression lines for ΔSV (continuous blue line; A) and ΔCO (continuous red line; B) and the identity line (continuous dark line) are shown. In light green, concordant SV and CO changes. In light pink, discordant SV and CO changes. Cb, a bias correction factor that measures how far the best-fit line deviates from a line at 45 degrees; CCC indicates concordance correlation coefficient; CI = confidence interval, CR = concordance rate.
