. 2020 Aug 10;9:e57390. doi: 10.7554/eLife.57390

Figure 1. | Characterising variation in the iPSC proteome and transcriptome.

(a) Experimental design and assays considered in this study. Genotype, RNA-Seq and quantitative proteomics data were obtained from the same cell material of 202 iPSC lines derived from 151 unrelated donors. (b) Variance component analysis of RNA and protein abundances across genes, considering different technical and biological factors. Shown is the distribution of the fraction of variance explained by different factors (upper panel) across proteins, and the number of genes with substantial variance contribution for each factor (>20% contribution; lower panel). Also shown are the number of genes that retain greater than 20% contribution after adjusting for the effect of the corresponding RNA profiles on protein abundance (light blue; see Materials and methods). (c) Association of protein level with X chromosome inactivation (XCI) status across 110 female iPSC lines. Shown are lowess regression curves for 322 and 312 proteins respectively that were identified as significantly up (red) - and down (blue) - regulated with loss of XCI in female iPSC lines (lower panel; 10% FDR). Selected gene ontology enrichments for these sets of proteins are shown (right-hand panel; Materials and methods). XCI status was estimated as the average fraction of allele-specific expression for the inactive chromosome across all chromosome X genes (Materials and methods). (d) Scatter plot of the fraction of variance explained by donor at the RNA (x-axis) versus protein (y-axis) level. Encoded in colour is the fraction of variance explained by donor effects at the protein level after adjusting for the effect of the corresponding RNA profiles on protein abundance (Materials and methods).

Figure 1—source data 1. HipSci proteomics iPSC lines.
The public ids, TMT batch, donor, gender, age and growth media for the HipSci iPSC lines used in this study are shown.
Figure 1—source data 2. RNA gene level expression across the 202 lines for genes recurrently detected at the protein level.
Lines are indexed by protein Ensembl gene Id. Columns are the line public names.
Figure 1—source data 3. Protein abundance values across the 202 and reference lines for genes recurrently detected at the protein level and with RNA expression (TPM >1).
Lines are indexed by protein Uniprot Id. First 229 columns contain intensity values after quality line filtering, batch correction and quantile normalisation. Line names are encoded as follows: [line public name]@[TMT batch]@[TMT channel]. Last columns include protein information: ‘gene_chromosome', 'gene_start', 'gene_end', 'ensembl_gene_id', 'gene_name', 'gene_strand', 'number_of_peptides', 'in_CORUM’.
Figure 1—source data 4. Protein and RNA variance components.
Variance decomposition for 6009 genes high RNA expression (TPM >1) and detected in lines at the protein level.
Figure 1—source data 5. Protein and RNA correlation with X chromosome inactivation.
Correlation with XCI status of protein and RNA profiles for the 6336 genes (6406 proteins) with high RNA expression (TPM >1) and detected in all female lines at the protein level.
Figure 1—source data 6. Functional enrichment of genes with protein or RNA profiles correlated with XCI.
This table enumerates the significant Genome Ontology terms and DNA regulatory motifs (FDR 0.05; fields 'source' and 'term_name') for different gene sets (field ‘molecular_layer’ and ’change_direction’): 1) RNA positively correlated with XCI inactivation, 2) RNA negatively correlated with XIC, 3) proteins positively correlated with XIC and without RNA nominal significance, and 4) proteins negatively correlated with XIC and without RNA nominal significance.

Figure 1.

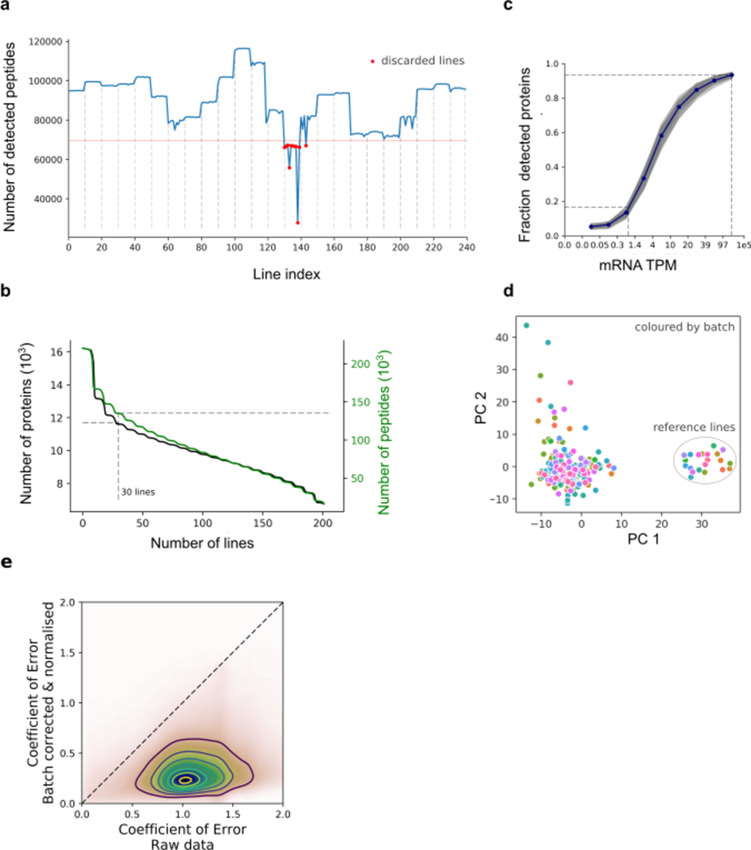
Figure 1—figure supplement 1. Protein quantification, quality control and batch correction.

Figure 1—figure supplement 1.

(a) Number of detected peptides across all 240 iPSC lines (including 23 replicates of the reference line) ordered by TMT processing batch (dashed vertical lines). The horizontal lines denote the QC cutoff of 75% of the median across lines (67,000 peptides). (b) Distribution of the number lines in which the peptides and proteins were detected. The number of recurrently detected peptides, or protein groups (at least one detected peptide per group), are shown as a function of the recurrence (considering 202 lines with QC-passing RNA and protein data). (c) Fraction of expressed genes detected at the protein level for increasing levels of expression at the RNA level (for each decile of RNA expression; grey: values for each cell line ; blue: average across cell lines). (d) Assessment of batch correction across TMT batches. Principal component analysis of all 202 iPS lines + 22 additional technical replicates of the reference cell line (HPSI0314i-bubh_3), which was included in each TMT batch. Colour denotes the TMT batch. (e) Scatter plot of the coefficient of variation of peptide abundance estimates across processing batches for the reference line, before (x-axis) and after (y-axis) batch correction and quantile normalisation. Note that the reference line is not used for estimating parameters of the batch adjustment (Materials and methods).
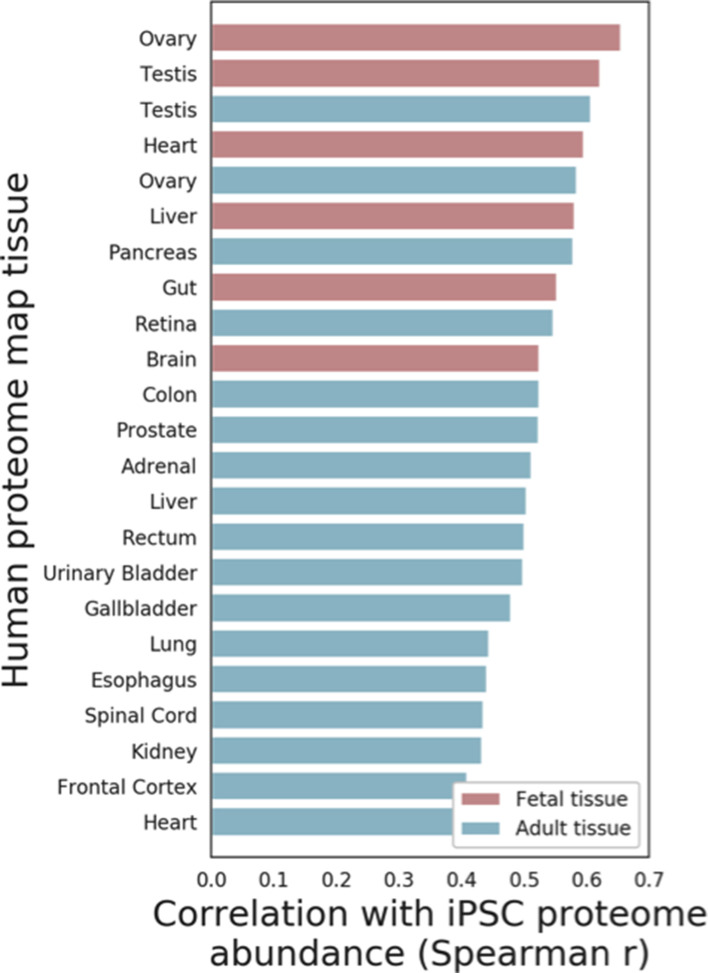
Figure 1—figure supplement 2. Comparison of iPSC proteome and somatic human tissues.

Figure 1—figure supplement 2.

Spearman correlation coefficients between the average iPSC proteome abundance and proteome profiles of 23 tissues obtained from the Human Proteome Map, including Fetal (Red) and Adult (Blue) tissues are shown (see Materials and methods for details).
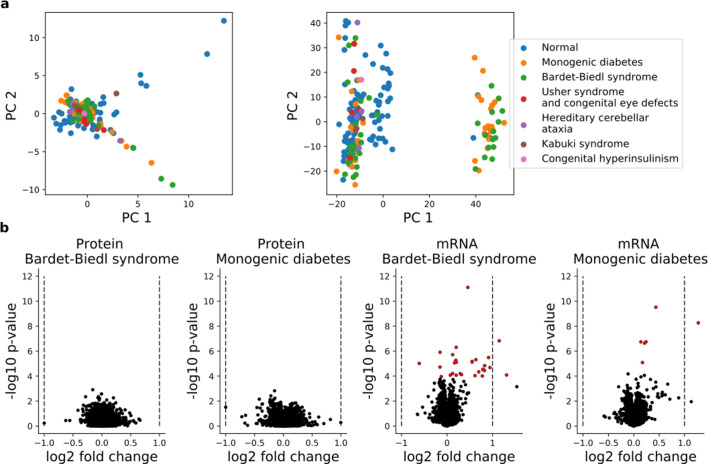
Figure 1—figure supplement 3. Comparison of the iPS transcriptome and proteome of disease and normal lines.

Figure 1—figure supplement 3.

(a) Principal components analysis of protein (left panel) and RNA (right panel) profiles of 202 iPSC lines, with individual lines color coded by disease status. In total 6583 proteins detected in all 202 cell lines and 16,852 genes with RNA expression (TPM >1) in at least 30 lines were considered. (b) Differential expression analysis between the largest disease entities (Bardet-Biedl;N = 38 and Monogenic diabetes; N = 38 and ‘Normal’; N = 112; Supplementary file 2) for protein (left panels) and RNA (right panels). p-Values and effect size estimates obtained from a linear model with the disease indicator as an exogenous variable are shown. For protein, the fold change is computed for each batch and averaged across batches. Significantly differential RNA or protein levels (FDR < 10%, Benjamini-Hochberg adjusted) are indicated in red.
Figure 1—figure supplement 4. Comparisons of variance component estimates before and after regressing out mRNA effects.

Figure 1—figure supplement 4.

Briefly, for each protein-RNA pair, the effect of RNA abundance on protein abundance was accounted for using a linear model, regressing out its effect on the protein abundance. The analogous variance component model as considered in Figure 1b is then fitted on this adjusted protein abundance (Materials and methods).
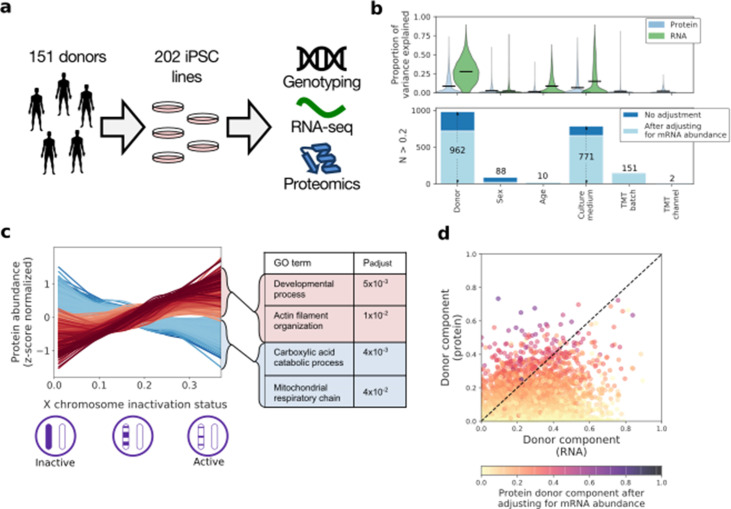
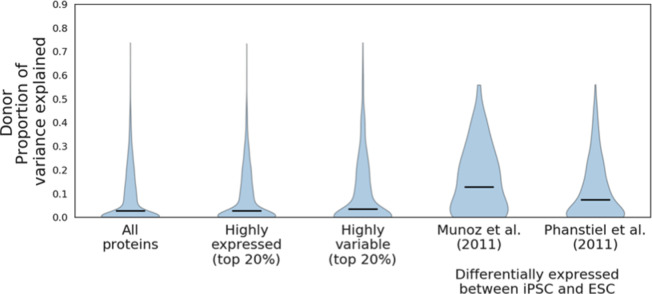
Figure 1—figure supplement 5. Donor variance components of proteins differentially expressed between iPSC and ESC.

Figure 1—figure supplement 5.

Donor variance component results for all proteins and subsets of highly expressed and highly variable proteins, compared to the donor variance components for proteins reported as differentially expressed between iPSC and Munoz et al., 2011 (a set of 81 proteins) and Phanstiel et al., 2011 (a set of 255 proteins) (see Materials and methods). Horizontal black bars denote median variance components.
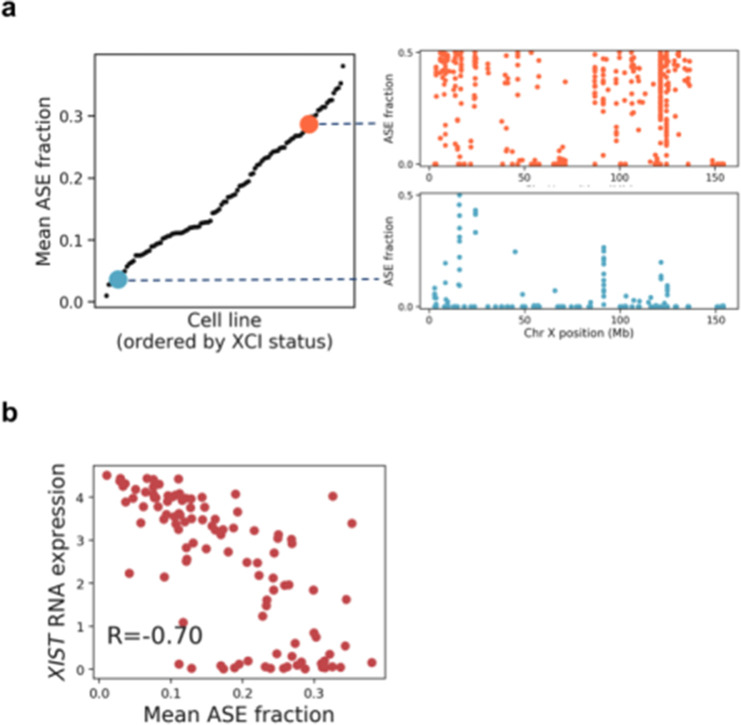
Figure 1—figure supplement 6. Quantification of X chromosome inactivation status in female iPSC lines using chromosome X ASE SNPs.

Figure 1—figure supplement 6.

(a) Mean allele-specific expression (ASE), averaged across all chromosome X heterozygous variants for all female iPSC lines included in this study (left), with illustrative examples of the distribution of SNP ASE measured across chromosome X (right). (b) Scatter plot between XIST RNA expression and mean ASE for chromosome X.