. 2020 Aug 10;9:e57390. doi: 10.7554/eLife.57390

Figure 2. Human iPSC cis protein and RNA QTLs.

(a) Number of genes with a protein (blue) or RNA (green) cis QTL (FDR < 10%) and pairwise replication of genetic effects. Left: Number of genes with a pQTL, either with (dark blue) or without (light blue) replicated RNA effect. Right: Number of genes with an eQTL, either with (dark green) or without (light green) replicated protein effect. Replication defined by assessing nominal significance (PV <0.01) of QTL in the respective other layer. (b) Local Manhattan plots displaying negative log p-values (PV) from cis RNA (top) and protein (bottom) QTL mapping for PEX6. The dashed line and the grey box indicate the genomic positions of the lead QTL and of the gene. Boxplots show RNA and protein expression for different alleles at the pQTL lead variant rs11752813, a variant in LD (r2 = 1, 1000 Genomes European populations phase 3) with the Alzheimer risk variant rs1129187 (Jun et al., 2016) (OR 1.13). (c) Cumulative fraction of eQTLs with replicated protein effects as a function of the eQTL effect size (from highest to lowest). (d) Prediction of protein replication of eQTLs, considering features derived from gene annotations, eQTL, RNA and protein data. Predictions were obtained using a random forest model trained on the protein replication status of eQTL (as in a; Materials and methods). Left: Feature importance scores. Right: Precision-recall curve for the model, evaluated in independent test fractions. The model performance was assessed by random sampling of training/testing data with a 80/20 split, performed 50 times. Shown in red is the average precision-recall across all sampled training/test splits and in thin grey lines results of individual folds.

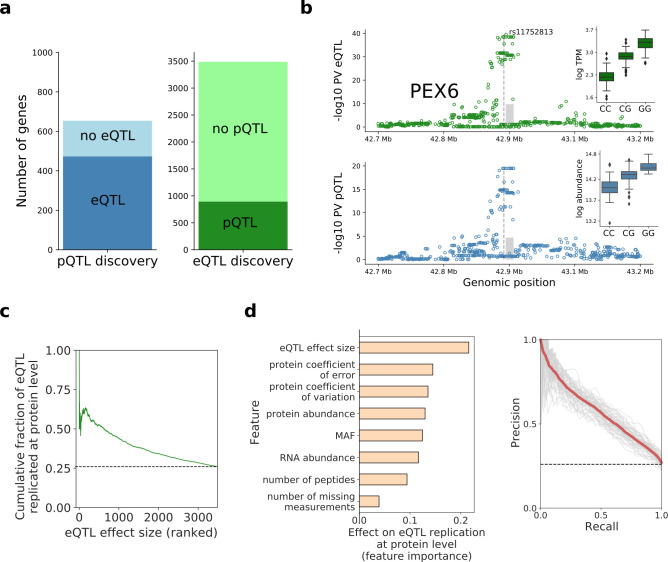
Figure 2—source data 1. pQTL_results.
The list of significant (FDR < 10%) genes with a pQTL provided as a supplementary file. Data fields are described in the table below.
Figure 2—source data 2. eQTL_results.
Reported are genes with a significant (FDR < 10%) QTL. It consists of variants mapped at RNA, gene resolution, for genes detected at both RNA and protein levels. This table includes the features used in the prediction of the pQTL status. The table columns are analogous to Figure 2—source data 1 pQTL_results.

Figure 2.

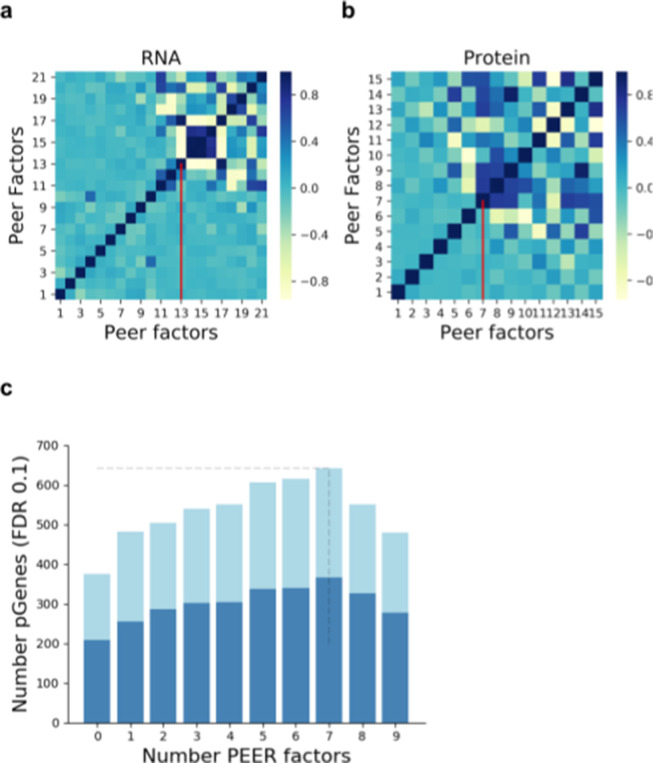
Figure 2—figure supplement 1. Selection of the number of PEER factors to adjust for unwanted variation.

Figure 2—figure supplement 1.

Pairwise correlation (Pearson correlation coefficient) between the Peer factors fitted on RNA (a) and protein data (b). Vertical red lines indicate the number of factors used within this study. (c) Number of genes with a pQTL (FDR < 10%) when accounting for increasing numbers of factors in the analysis. Dark blue denotes pQTLs replicated at RNA level (defined as nominal PV <0.01; Materials and methods).
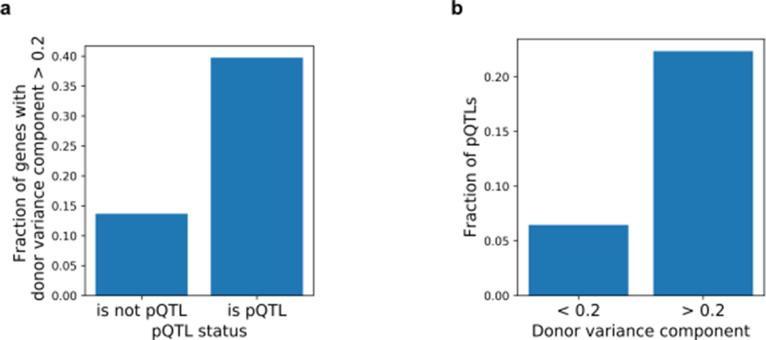
Figure 2—figure supplement 2. Relationship between estimates of donor variance component and cis pQTLs.

Figure 2—figure supplement 2.

(a) Barplot showing the fractions of genes with significant variance donor component for genes with and without cis pQTLs. (a) Barplot showing the fractions of genes with a cis pQTL for genes stratified by the relative donor variance.
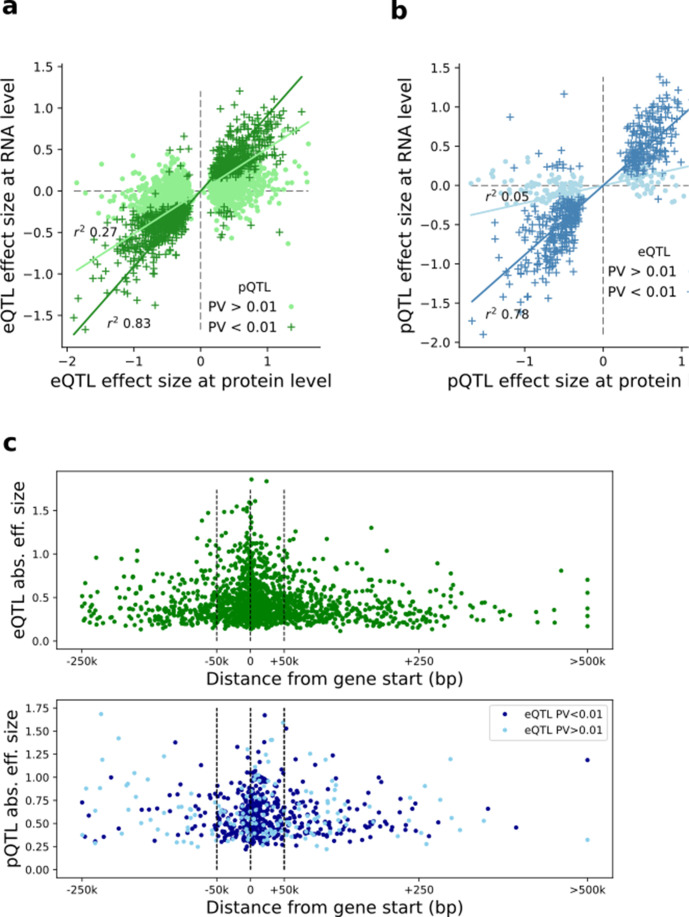
Figure 2—figure supplement 3. Comparison of eQTL and pQTL effect sizes and genomic positions.

Figure 2—figure supplement 3.

(a) Scatter plot of QTL effect size estimates for eQTL lead variants (FDR < 0.1) at the RNA and protein level, respectively. Dark green denotes eQTLs nominally significant at pQTL; Light green denotes eQTLs lacking protein replication. (b) Scatter plot of QTL effect size estimates for lead pQTL variants (FDR < 0.1) at the protein and RNA level, respectively. Dark blue denotes pQTLs nominally significant at eQTL; Light blue denotes pQTLs lacking eQTL replication. (c) Distribution of eQTL(top) and pQTL (bottom) around the gene start. Y-axis indicates the QTL effect size. pQTLs are stratified by eQTL replication status.
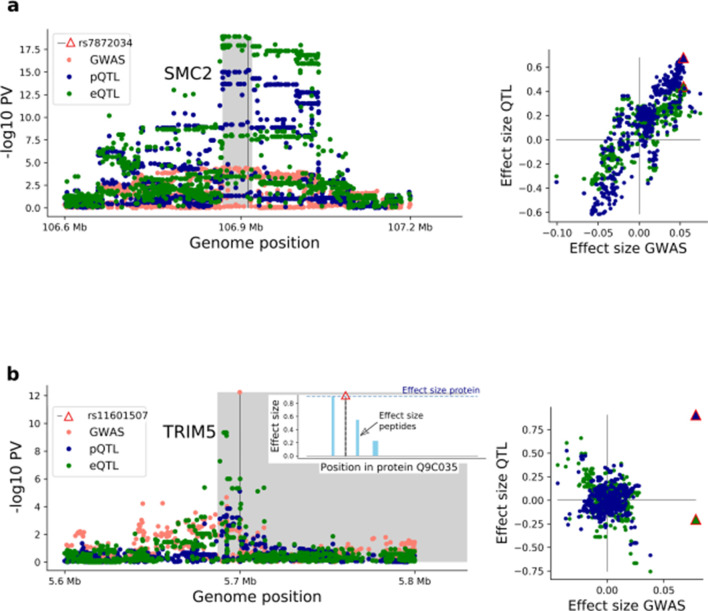
Figure 2—figure supplement 4. Example iPS eQTL and pQTL variance with evidence for co-localisation with GWAS variants.

Figure 2—figure supplement 4.

(a) Left - local Manhattan plot for the cis region of gene SMC2 (lead pQTL rs7872034), displaying eQTL and pQTL association negative log p-values, as well as negative log p-values obtained from a GWAS of invasive ovarian cancer (Phelan et al., 2017) (pQTL cumulative co-localisation posterior probability 0.8; eCAVIAR). Right: scatter plot with eQTL and pQTL effect sizes (y-axis) juxtaposed with effect sizes on invasive ovarian cancer (x-axis). The red triangle indicates the lead pQTL for protein and mRNA effects. (b) Local Manhattan plot of the cis region for the gene TRIM5 (lead pQTL missense variant rs11601507) displaying eQTL and pQTL association negative log p-values, as well as negative log p-values obtained from a GWAS study for coronary artery disease risk (van der Harst and Verweij, 2018). Right: scatter plot with eQTL and pQTL effect sizes juxtaposed with effect sizes on coronary artery disease risk. Left plot insert shows the position in Q9C035, the protein encoded by TRIM5, of the missense variant rs11601507 and of the peptides used for protein quantification.