. 2020 Aug 10;9:e57390. doi: 10.7554/eLife.57390

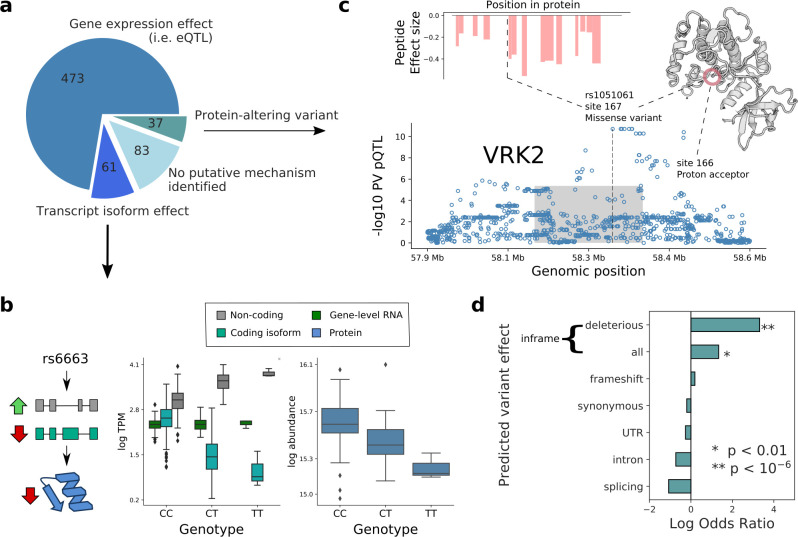
Figure 3. Putative mechanisms of pQTL from transcript isoform regulation and protein-altering variants.

(a) Categorisation of 654 pQTL into four classes according to their putative mechanism: gene expression effect (i.e. replicated at eQTL level), transcript-isoform specific effect (i.e. not replicated at eQTL level, but significant at transcript isoform level), protein-altering variant (i.e. at least one inframe variant in LD with lead pQTL variant) without expression effect at RNA level, and without any putative mechanism identified. (b) Example pQTL without eQTL replication (rs6663; gene MMAB), with a directional opposite effect on a coding and non-coding isoform (cyan: ENST00000540016; grey: ENST00000537496), resulting in no overall change in gene expression level. (c) The pQTL variant (rs1051061) is a protein-altering variant associated with VRK2 protein abundance (below), and lacks detectable effect on RNA expression. The pQTL signal is observed across 15 peptides spanning the VRK2 protein sequence (above, left). This variant is associated with schizophrenia risk, and is located at the kinase active site, proximal to the proton acceptor residue (above, right). The dashed line and the grey box indicate the genomic positions of the lead QTL and of the gene. (d) Enrichment of RNA-independent pQTL in different categories of predicted variant effects, using gene variants in high LD with pQTLs (proxy gene variants; r2 >0.8; within the cis gene boundaries). Enrichment calculated using Fisher’s exact test.

Figure 3—source data 1. tQTL_results.
Consists of variants mapped at RNA, transcript isoform resolution, for genes detected at both RNA and protein levels. The table columns are analogous to Figure 2—source data 1 pQTL_results.
Figure 3—source data 2. pepQTL results.
Consists of variants mapped at the protein level, peptide resolution, for genes detected at both RNA and protein levels. The table columns are analogous to Figure 2—source data 1 pQTL_results.

Figure 3.

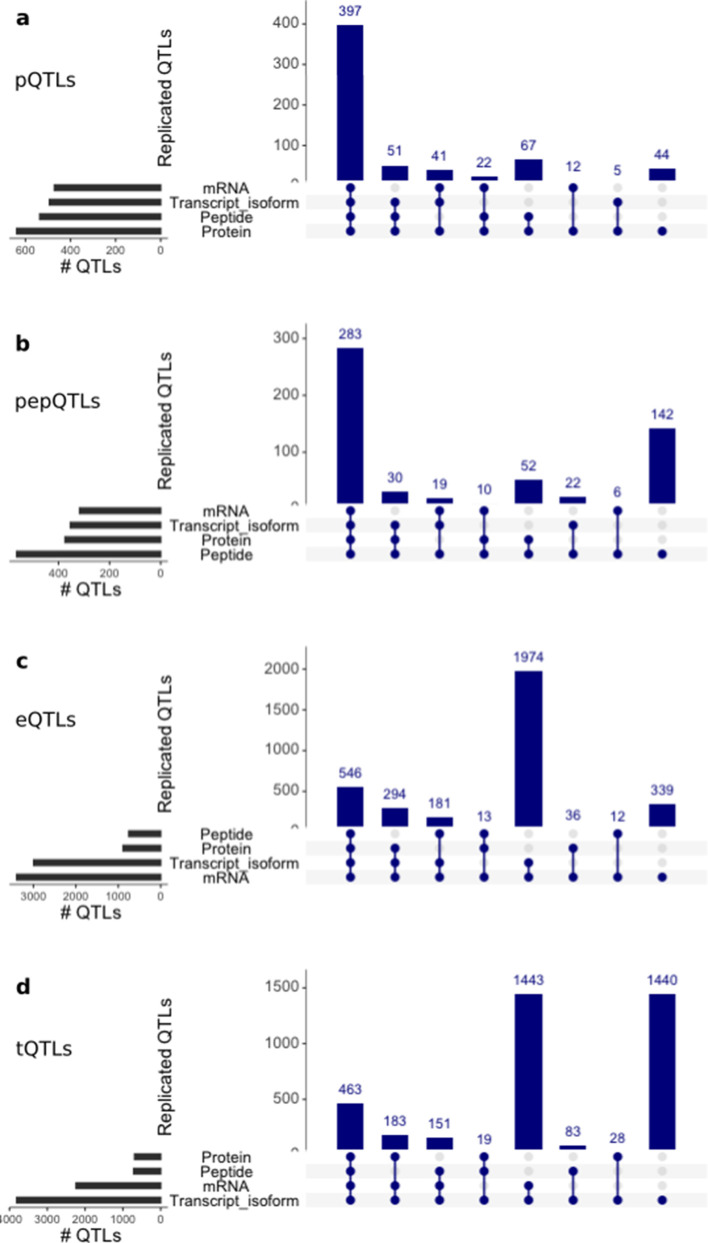
Figure 3—figure supplement 1. Discovery and replication of cis QTLs at protein and RNA levels.

Figure 3—figure supplement 1.

Upset plots showing from top to bottom: genome-wide significant cis QTLs (FDR < 10%) for protein (pQTLs), peptides (pepQTLs), gene expression (eQTLs) and transcript isoforms (tQTLs) summarised at gene level. For each discovery set the replication (i.e. nominal PV <0.01 and effect sizes of the same direction) is assessed in the respective other layers, and the number of genes with replicated effects for each intersection is displayed. For comparison purposes, we show only QTLs assessed in all the four layers.
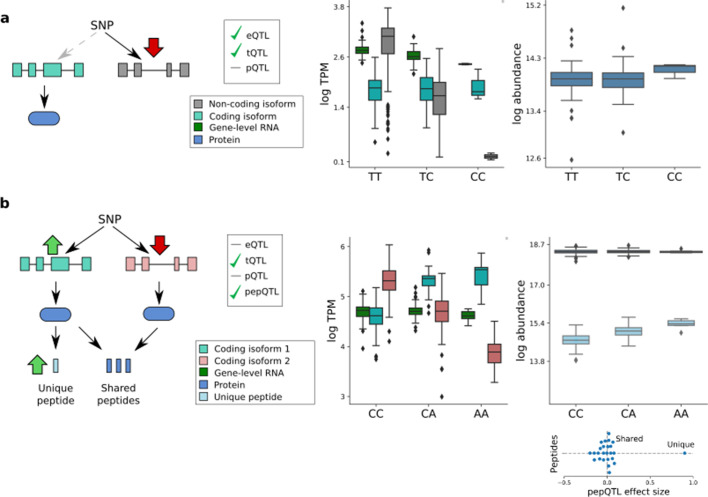
Figure 3—figure supplement 2. Isoform-specific genetic effects.

Figure 3—figure supplement 2.

(a) An eQTL arising from a non-coding transcript QTL. The variant rs2709373, an eQTL variant for METTL21A, was associated with the abundance of the non-coding transcript isoform ENST00000477919 without detectable effect on the abundance of any protein-coding transcript isoform and thus not altering protein expression levels from this locus. (b) A transcript QTL that is neither an eQTL nor a pQTL. The variant rs12795503 has effects in opposite directions on the coding transcripts ENST00000301843 (light blue) and ENST00000346329 (light red), resulting in no detectable effects on either the RNA or protein level. The transcript-specific effect on ENST00000301843 is detectable at the peptide level (peptide QDSAAVGFDYK; uniquely mapping to exon 11 of ENST00000301843). Subplot shows genetic effect sizes for all peptides mapped to CTTN, with the peptides that are shared by both isoforms, and unique to the ENST00000301843 isoform, labelled.
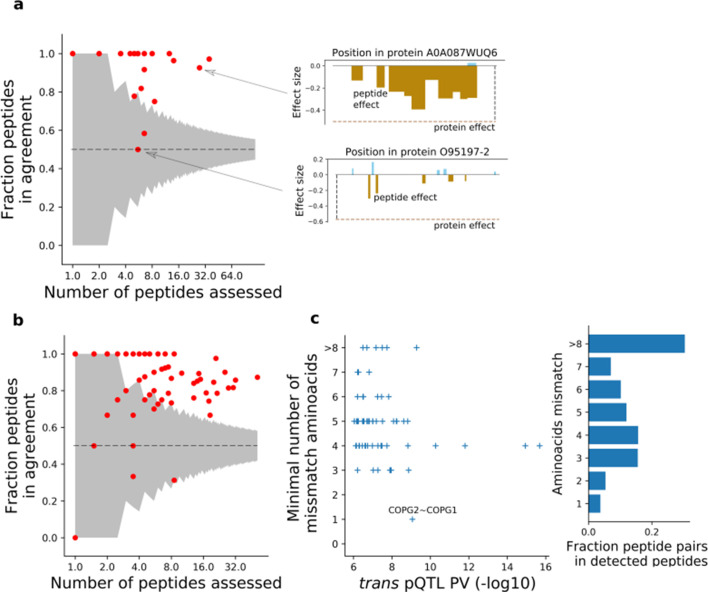
Figure 3—figure supplement 3. Peptide resolution assessment of pQTLs.

Figure 3—figure supplement 3.

(a) Fraction of peptides supporting the genetic effects of missense variants detected at the protein level and not replicated in RNA. For each missense variant - cis pQTL lacking mRNA replication (either eQTL or tQTL), we show the fraction of peptides mapped to the protein with direction of genetic effects consistent with the effect at the protein level. The grey area indicates the random agreement fraction (assuming equal probability of either effect direction; CI: 5–95%). Right panels illustrate genetic effects at protein (dashed horizontal line) and peptide (vertical bars) levels. (b) Fraction of peptides supporting the 68 trans protein QTL. For peptides mapping to the trans protein, we show the fraction of peptideQTLs with direction of genetic effects consistent with the pQTL. (c) Assessment of protein sequence similarity for cis/trans gene pairs. For the top 69 (FDR 0.1) trans pQTLs, the number of missmatching aminoacids are shown, based on the local alignment between peptides of the source cis pQTL and the affected trans protein (Materials and methods). For each cis - trans association, we report the minimal number of mismatches across all peptides used for the cis protein. Right: barplot showing the number of amino acid differences between pairs of detected peptides. The proportion was calculated from detected peptides ordered by sequence, using 10 random groups of 1000 peptides.
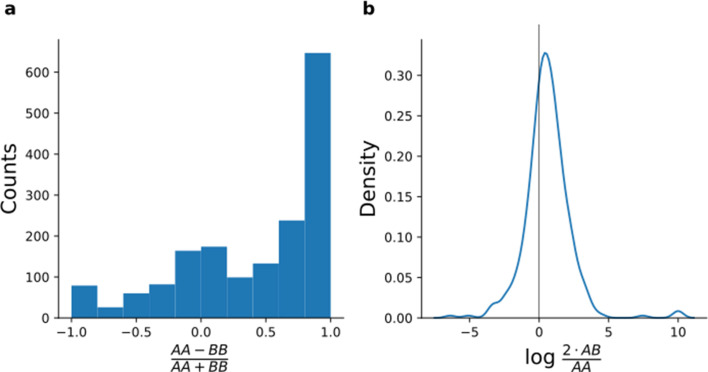
Figure 3—figure supplement 4. Quantification of peptides containing coding polymorphisms.

Figure 3—figure supplement 4.

(a, b) For each peptide with an SNP changing the peptide sequence (Materials and methods), peptide intensities were averaged across samples from donors who were homozygous for the reference allele (AA), heterozygous (AB), and homozygous for the alternative allele (BB). To increase robustness, we limit the analysis to variants with at least three alternative homozygous and at least three heterozygous lines. (a) Histogram comparing the intensity average of homozygous samples for peptides containing coding polymorphisms. (b) Density plot of the ratio between the average of the heterozygous samples and the reference homozygous samples restricted on the peptides which were not detected for the alternative homozygous samples.