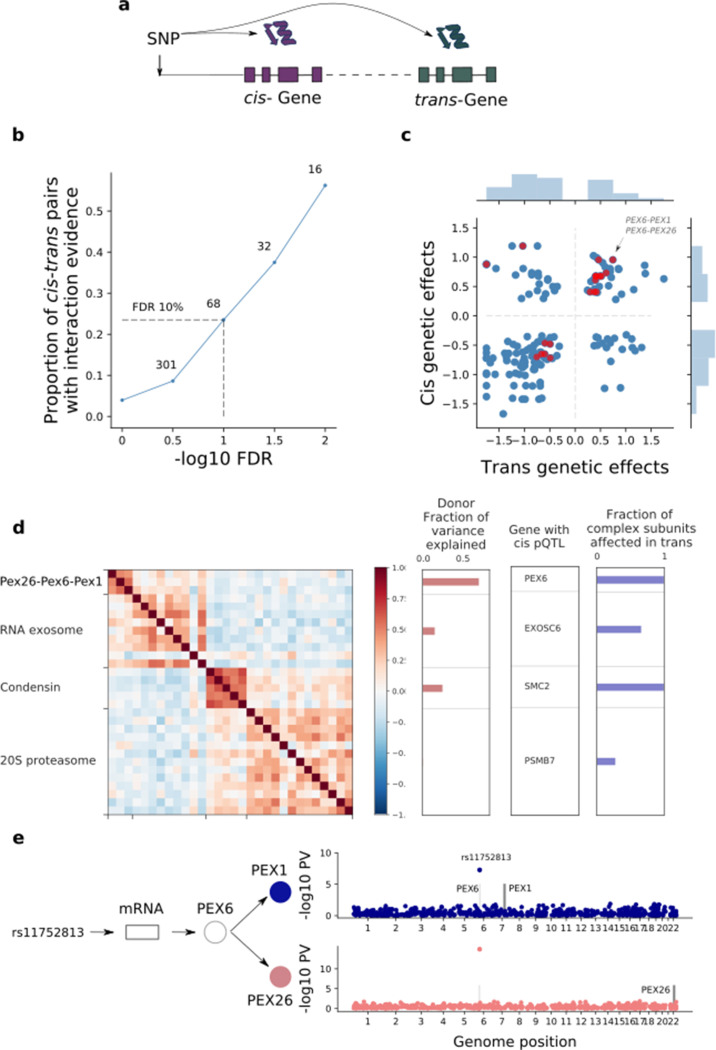
Figure 4. | Trans effects on the iPSC proteome.
(a) Strategy for mapping trans genetic effects on protein abundance. Lead cis pQTL variants were considered for proteome-wide association analysis. (b) Enrichment of previously catalogued protein-protein interactions among significant trans pQTLs. Shown is the fraction of cis-trans gene pairs linked by a trans pQTL with evidence of protein-protein interactions (based on the union of CORUM, IntAct, and StringDB), as a function of the considered FDR threshold for trans pQTL discovery. The dashed lines correspond to FDR < 10%. Numbers indicate the number of trans pQTL identified for each FDR threshold. (c) Comparison of genetic effect sizes, in cis and trans, for significant (FDR < 10%) trans pQTLs. Red points indicate cis-trans pairs with evidence for protein-protein interactions defined as in b. (d) Left: Protein co-expression of protein complex subunits defined based on CORUM. Right: i) subunit with the most significant cis pQTL; ii) fraction of subunits in association with the cis pQTL at nominal significance (PV <0.01). iii) fraction of the average cluster protein expression level explained by donor effects. (e) Trans regulation of the PEX26-PEX6-PEX1 complex. The variant rs11752813 (LD r2 = 1 with rs1129187) is associated in cis with changes in the RNA and protein abundance of PEX6 and in trans with changes in the protein abundance of PEX1 and PEX26.

