Figure 2.

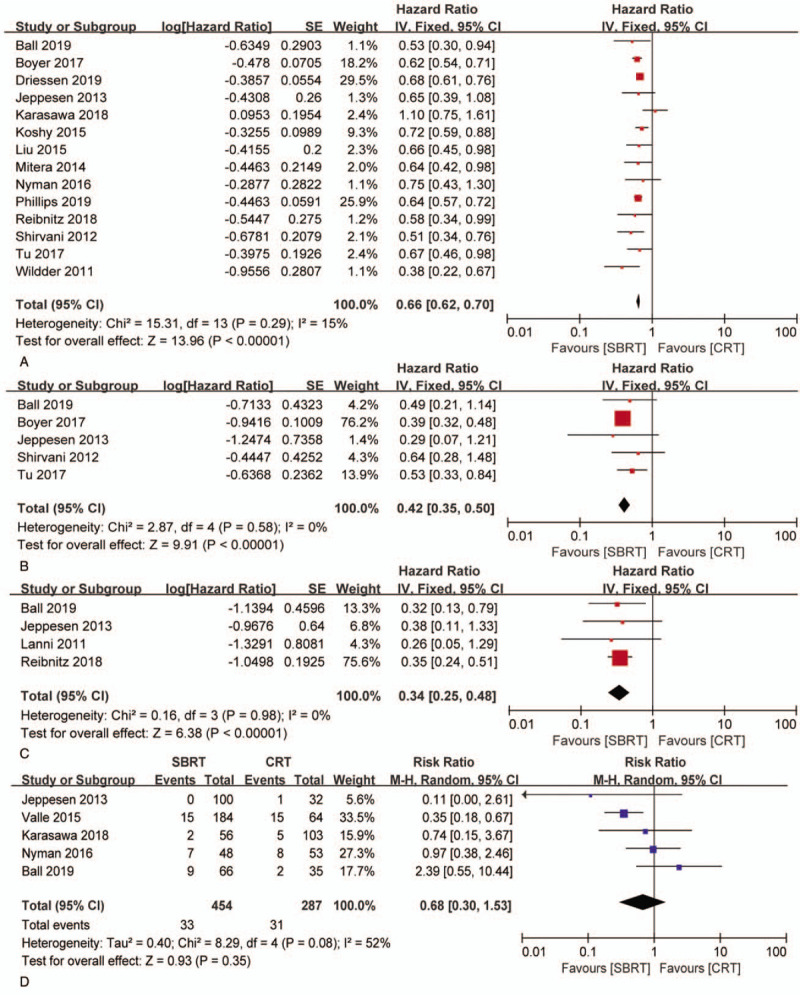
Forest plot of HRs for OS (A), LCSS (B), PFS (C) and forest plots of RRs for grade 3–5 AEs (D) associated with SBRT versus CRT.

Forest plot of HRs for OS (A), LCSS (B), PFS (C) and forest plots of RRs for grade 3–5 AEs (D) associated with SBRT versus CRT.