
FIGURE 1.
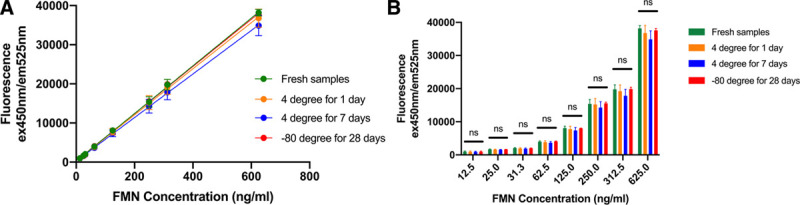
A, Concentration curves of FMN generated by fluorescence spectrometry. B, Comparison of the FMN fluorescence readings of fresh samples, samples stored at 4°C for 1 d and 7 d, and at –80°C for 28 d (n = 3).
Official websites use .gov
A
.gov website belongs to an official
government organization in the United States.
Secure .gov websites use HTTPS
A lock (
) or https:// means you've safely
connected to the .gov website. Share sensitive
information only on official, secure websites.
A, Concentration curves of FMN generated by fluorescence spectrometry. B, Comparison of the FMN fluorescence readings of fresh samples, samples stored at 4°C for 1 d and 7 d, and at –80°C for 28 d (n = 3).