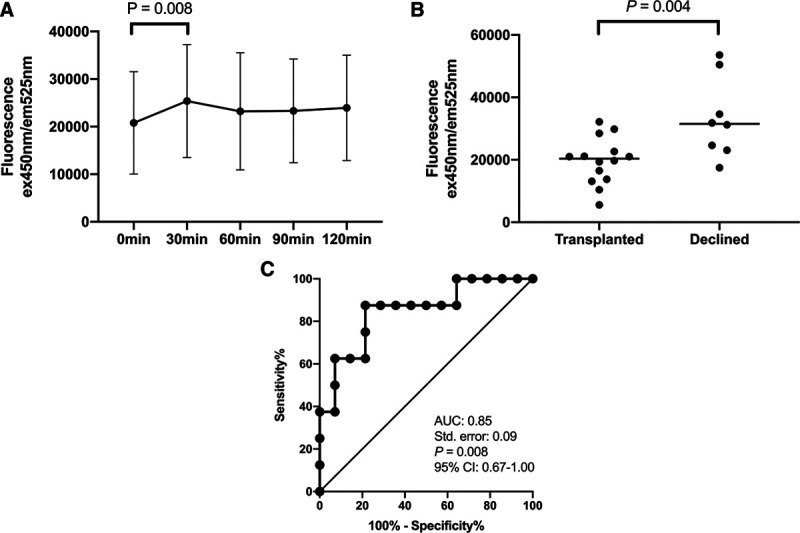
FIGURE 3.

A, The changes in the FMN fluorescence readings during the 2 h of abdominal normothermic regional perfusion. B, Comparison of the FMN levels at 30 min of NRP in the livers that were accepted for transplantation (n = 15) to those of the ones that were declined (n = 8). C, ROC analysis of FMN levels at 30 min of NRP on prediction of livers being accepted for transplantation after NRP. AUC, area under the receiver-operating characteristic curve; CI, confidence interval; FMN, flavin mononucleotide; NRP, normothermic regional perfusion. ROC, receiver-operating characteristic curve.
