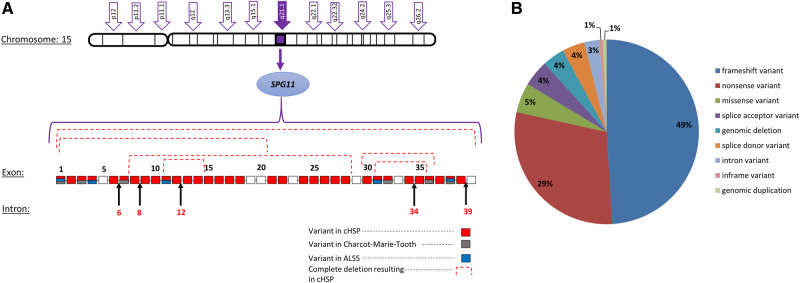
Figure 1.
Genetic heterogeneity in SPG11-HSP. (A) Schematic representation of the SPG11 gene. The specific pathogenic variants are represented in different colours, indicating the specific neurological disorder. (B) Pie chart representing the distribution of SPG11 mutations. Data retrieved from ClinVar and Locus Specific Mutation Databases. cHSP = complicated HSP.

