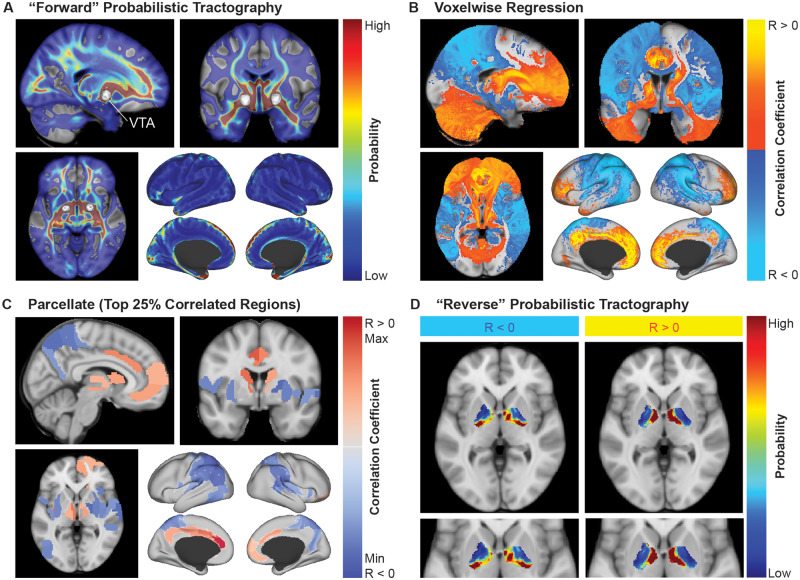
Figure 1.
Overview of the methodological approach. (A) The bilateral VTAs for each patient (n = 66) were used to generate probabilistic tractography maps averaged over 40 HCP subjects. (B) Voxelwise regression was performed to identify voxels that were positively correlated (R > 0) or negatively correlated (R < 0) with outcome scores. These correlation maps were used to predict clinical outcome scores. (C) The maps from B were parcellated into the top 25% correlated regions. (D) The positively correlated regions and negatively correlated regions from C were used to generate ‘reverse’ probabilistic tractography to parcellate the total volume of stimulation across all patients into areas connected to positively correlated networks and areas connected to negatively correlated networks.

