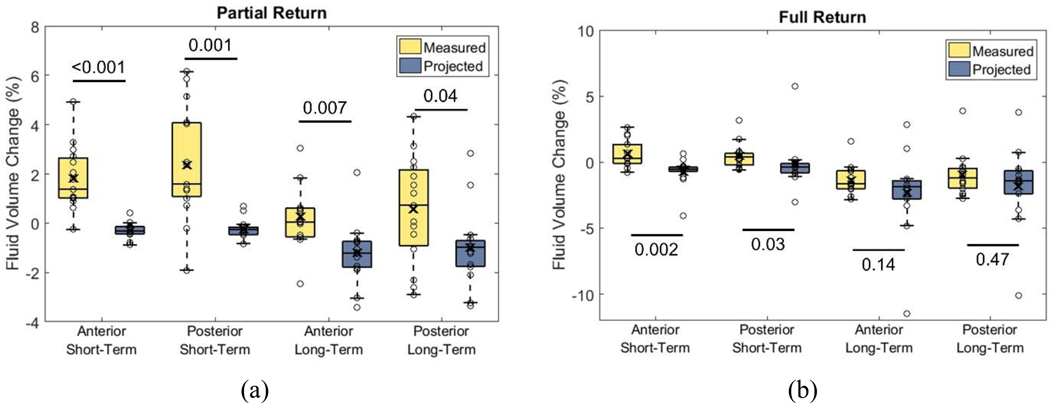
Fig. 4a,b. Percent limb fluid volume differences between measured and projected data.
a: Partial Return. b: Full Return. Circles are data for each participant. Box limits indicate the 25th and 75th quartile. Line within boxes is the median. “X” inside boxes represents the mean. Graphical presentation of data from all participants is included in Appendix 2.

