Figure 4.

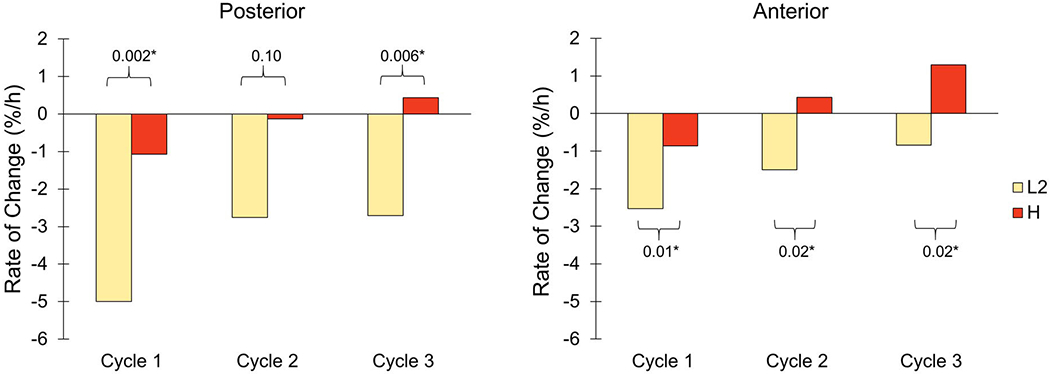
Rates of percent limb fluid volume change for low activity (L2) and high activity (H) for each cycle. Data from the posterior (left) and anterior (right) regions are shown. *Statistical significance.

Rates of percent limb fluid volume change for low activity (L2) and high activity (H) for each cycle. Data from the posterior (left) and anterior (right) regions are shown. *Statistical significance.