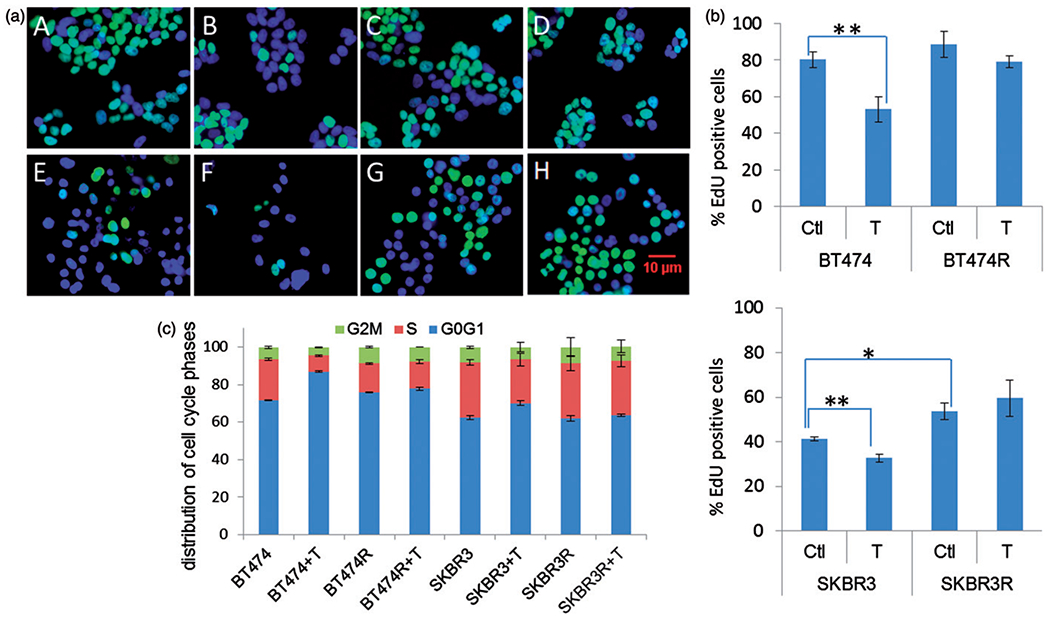
Figure 2.

Trastuzumab-resistant cells BT474R and SKBR3R expressed more aggressive phenotypes than parental BT474 and SKBR3. (a) Cell proliferation measured by EdU incorporation. EdU incorporated cells are shown in green. Cell nuclei were stained blue (DAPI). A: BT474, B: BT474+T, C: BT474R, D: BT474R+T, E: SKBR3, F: SKBR3+T, G: SKBR3R, H: SKBR3R+T. (b) Quantification of the data from a Student’s t-test were used to process the data. [* significant (t<0.05); ** most significant (t<0.01)]. Experiments were repeated at least three times. Bars represent mean and standard deviation values. Ctl: control untreated; T: trastuzumab treated. (c) FACS data demonstrates the G0/G1 fraction of the cell cycle was increased and S-phase was decreased after exposing to trastuzumab in BT474 and SKBR3 cells; in the trastuzumab-resistant BT474R and SKBR3R cells, neither G0/G1 or S-phase was affected by trastuzumab exposure.
